Download
1 / 20
200 likes | 211 Views
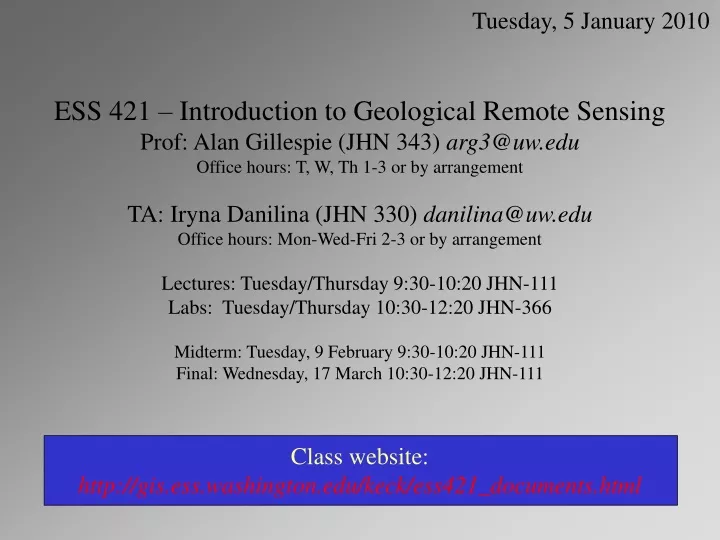
Tuesday, 5 January 2010. ESS 421 – Introduction to Geological Remote Sensing Prof: Alan Gillespie (JHN 343) arg3@uw.edu Office hours: T, W, Th 1-3 or by arrangement TA: Iryna Danilina (JHN 330) danilina@uw.edu Office hours: Mon-Wed-Fri 2-3 or by arrangement

E N D
Tuesday, 5 January 2010 ESS 421 – Introduction to Geological Remote Sensing Prof: Alan Gillespie (JHN 343) arg3@uw.edu Office hours: T, W, Th 1-3 or by arrangement TA: Iryna Danilina (JHN 330) danilina@uw.edu Office hours: Mon-Wed-Fri 2-3 or by arrangement Lectures: Tuesday/Thursday 9:30-10:20 JHN-111 Labs: Tuesday/Thursday 10:30-12:20 JHN-366 Midterm: Tuesday, 9 February 9:30-10:20 JHN-111 Final: Wednesday, 17 March 10:30-12:20 JHN-111 Class website:http://gis.ess.washington.edu/keck/ess421_documents.html
Lectures Labs Lectures Labs Reading Reading Class structure Model 2(ESS 421) Model 1
Lab Exercises° one lab per week, handed out Tuesdays° due the following Tuesday (or as noted in outline) in class ° lab files (e.g., “Lab_1.doc”) are available from the website° print only the “Answers” file of the lab (e.g., “Lab_1-answers.doc”) & turn in only this sheet to TA with your answers late work will be docked 10% per day ° at the beginning of the lab on Tuesdays there will be a short one-page gradedquiz on the lab just turned in, plus reading for the past week. Bring a sheet of paper for the answers and turn in to the TA. ° the labs just handed in will be reviewed after the quiz
Reading Assignments°Text isLillesand, Kiefer, and Chipman “Remote Sensing and Image Interpretation” 6th ed. 2007, John Wiley ° Reading assignments in the text are augmented with other material available on class website
Examinations & Grading°Midterm and Final will both contain questions from the lectures, reading, and labs ° Midterm covers 1st half of class °Final covers whole classwith emphasis on 2nd half Labs - 30%Lab quizzes - 20%Midterm - 20%Final - 30% Failure to turn in all work in each of the 4 categories above will result in an incomplete
Tuesday, 5 January 2010 Lecture 1: Introduction Reading assignment: Lillesand, Kiefer & Chipman: Ch 1.1, 1.2, 1.6, 1.7, 1.10, 1.11 Ch 2.9 – Multiband imaging App. A – Concepts & terminology (p. 727-731) App. B – Data and resources (p. 732-735) 1
What is remote sensing? Measurement from a distance - Hazardous locales - “Denied terrain” Nodong, N. Korea 2
What is an image? X (longitude) Y (latitude) 3
Images in combination with maps add to interpretive power Geographic Information System (GIS) 4
Images can be made at different wavelengths of light l=11.405 mm l=10.755 mm l=10.275 mm l=9.205 mm l=8.735 mm l l=0.870 mm l=0.804 mm l=0.658 mm l=0.542 mm l=0.462 mm Y Image visualizations display only a subset of the data X NASA MASTER airborne 50-band multispectral image 5
and displayed as color pictures l=11.405 mm l=10.755 mm l=10.275 mm l=9.205 mm l=8.735 mm l l=0.870 mm l=0.804 mm l=0.658 mm l=0.542 mm l=0.462 mm Y R=0.658mm G=0.542mm B=0.462mm X NASA MASTER airborne 50-band multispectral image NASA MASTER airborne 50-band multispectral image 6
Only 3 bands at a time can be visualized this way… but there is more information, and can be shown in a spectrum Spectrum l=11.405 mm l=10.755 mm l=10.275 mm l=9.205 mm l=8.735 mm l l=0.870 mm l=0.804 mm l=0.658 mm l=0.542 mm l=0.462 mm Y R=0.658mm G=0.542mm B=0.462mm X 7
Spectra are different and convey information about composition Note the scale change! R=0.658mm G=0.542mm B=0.462mm 8
Images can be made at different wavelengths of light l=11.405 mm l=10.755 mm l=10.275 mm l=9.205 mm l=8.735 mm l l=0.870 mm l=0.804 mm l=0.658 mm l=0.462 mm l=0.542 mm Y X 9
They reveal different information about scene composition THERMAL INFRARED VISIBLE 10
Images are not limited to light reflected or emitted from a surface. They can be made over time, or of derived or calculated parameters. Increasing concentration of CO Carbon monoxide at 500 mB, from NASA’s Terra/Moppitt 12
How do remote sensing and GIS fit together in geospatial analysis? Remote sensing GIS Image processing Analysis & Interpretation Operations & acquisition Engineering Calibration Validation physics of remote sensing Scanners & data project goals scene Knowledge 13
LKC App A: radiometric terminology (p. 742) Radiant energy (J) [Q] Radiant flux (J s-1 = W) [Ф] Radiant intensity (W sr-1) [I] Irradiance (W m-2) [E] Radiance (W m-2 sr-1) [L] Spectral irradiance (W m-2 µm-1) [El] Spectral radiance (W m-2 sr-1 µm-1) [Ll]
The electromagnetic spectrum In the spectrum, energy is dispersed by a grating or prism according to frequency or wavelength Gamma rays <10-4 µm X rays 10-4 - 10-2 µm Ultraviolet 0.01-0.45 µm Visible blue B 0.47-0.48 µm Visible green G 0.51-0.56 µm Visible red R 0.63-0.68 µm Near infrared NIR 0.67-1.4 µm Shortwave infrared SWIR 1.4-2.5 µm Mid-wave infrared MIR 3.5-5.5 µm Longwave thermal infrared LWIR 8-14 µm Microwave (Radar) 0.1mm-1 m Radio 1 m - 10 km Reflected sunlight Thermally emitted radiation Short l High energy High frequency Long l Low energy Low frequency
What topics are covered in ESS 421? • physical basis of remote sensing • spectra • radiative transfer • image processing • radar/lidar • thermal infrared • applications 14