Download
1 / 8
220 likes | 541 Views
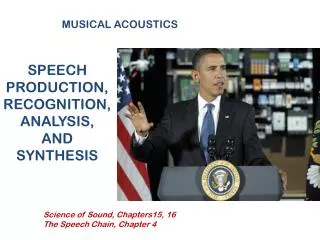
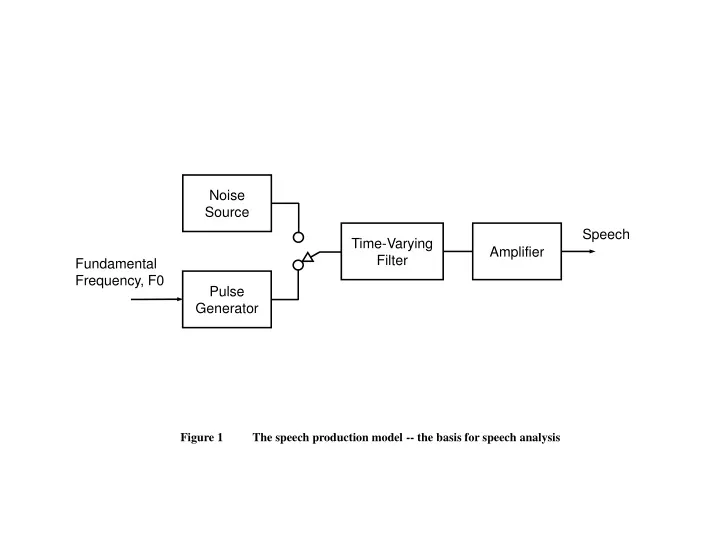
Noise Source. Speech. Time-Varying Filter. Fundamental Frequency, F0. Amplifier. Pulse Generator. Figure 1 The speech production model -- the basis for speech analysis. 4. FREQ (kHz). 0. 2.34. 0. TIME (sec). Figure 2 An example of a spectrogram for a speech segment. 5 4 3 2.

E N D
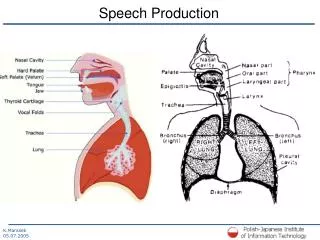
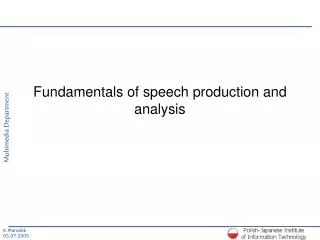
Noise Source Speech Time-Varying Filter Fundamental Frequency, F0 Amplifier Pulse Generator Figure 1 The speech production model -- the basis for speech analysis
4 FREQ (kHz) 0 2.34 0 TIME (sec) Figure 2 An example of a spectrogram for a speech segment.
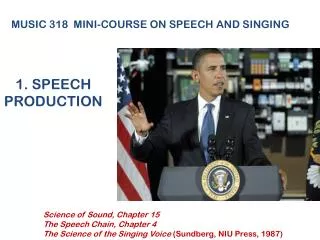
5 4 3 2 MOS Score 2.4 4.8 8 16 32 64 LPC CELP CELP LD-CELP ADPCM PCM Bit Rate (kb/s) & Coder Figure 3 Speech quality in terms of MOS for various coders at typical bit rates (in kb/s).
Text Normalization “Dr. Smith lives at 111 Smith Dr.” ASCII Text Syntactic/Semantic Parser “Lives” (verb) vs. “Lives” (noun) Dictionary Pronunciation dictionary morphemic decomposition rhyming Letter To Sound Rules Rules used where dictionary derivation fails Phonemes Prosody Rules Intonation and duration Diphone and Polyphone Concatenation Speech Synthesis Speech output Figure 4 A block diagram of an English text-to-speech system
Stored Vocabulary Patterns/Models Input Speech Pattern Response Comparison Decision Figure 5 Automatic speech recognition using a pattern recognition framework.
N1 Noise Power Estimation S1 P1 S1 /P1 Power Estimation Noisy Speech Enhanced Speech Bank of Filters Sum Figure 6 A speech enhancement system based on spectral subtraction.
O S + N’ S + N’ S N’ N H* N H (A) (B) Figure 7 (A) A model for signal contamination; (B) A set up for Canceling the contamination from the desired signal.
DISCOMFORT DISCOMFORT 120 120 100 100 80 80 INTENSITY (dB SPL) INTENSITY (dB SPL) 60 60 40 40 THRESHOLD 20 20 THRESHOLD 0 0 2 3 4 5 6 7 8 2 3 4 5 6 7 8 2 3 4 5 6 7 8 2 3 4 5 6 7 8 2 3 4 2 3 4 10 10 10 10 10 10 FREQUENCY (Hz) FREQUENCY (Hz) (a) (b) Figure 8 Typical thresholds of hearing and discomfort: (a) normal ear, (b) ear with hearing loss.