Download
1 / 16
160 likes | 163 Views
Objective Read World Uncertainty Analysis. CMSC 2003 July 21-25 2003. Introduction. Confidently optimize production processes against their requirements Inputs vs. Outputs Need to simulate process performance to optimize accuracy, speed, and costs

E N D
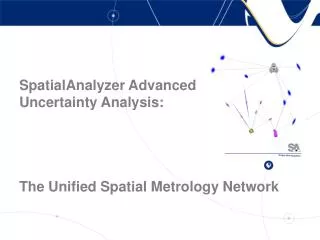
Objective Read World Uncertainty Analysis CMSC 2003 July 21-25 2003
Introduction • Confidently optimize production processes against their requirements • Inputs vs. Outputs • Need to simulate process performance to optimize accuracy, speed, and costs • Need reliable (easy to understand) uncertainty estimates for complex 3D measurements on the factory floor • Need to estimate the benefits of combining measurement systems • Common Type Network (n Trackers) • Hybrid Type Network (Scanners + Trackers etc.) • Need real-time (easy to understand) feedback on measurement system performance • Need traceable measurement uncertainty for each assembly
Inputs Object Characteristics (e.g., Volume, Surface) Expected Tolerances Instrument Types and Number of Stations Cycle Time Measurement Constraints (e.g., line-of-sight, targeting the actual critical features) Outputs GUM Compliant Uncertainty Estimates of Feature Measurements Measurement Plan Number of Instruments (Stations) Types of Instrument Instrument Placement Targeting Requirements Network/Orientation Requirements Transform vs. Bundle Number of Common Pts Closure Analysis Dependencies Process Description
Background: Uncertainty • Guide to Uncertainty in Measurement (GUM) • ISO way to express uncertainty in measurement • Error and Uncertainty are not the same • Quantify components of Uncertainty • Type A vs. B depends on the estimation method • A = Statistical Methods (e.g., Monte Carlo, 1st-order Partials) • B = Other means (e.g., measurements, experience, specs) • Random vs. Systematic Effects (e.g., Noise vs. Scale) • Both are components estimated with Type A or B methods • Uncertainty Estimates can contain Type A & B methods • GUM mandates uncertainty statements in order to provide traceability for measurement results • A measurement result is complete only when accompanied by a quantitative statement of its uncertainty 1 1 - Taylor and Kuyatt, 1994: NIST TN/1297
Background: Uncertainty • Specifications • Instrument specifications are not representative of the results from actual use of the instrument in a network • 3D Measurement Networks • 1 Instrument + References • 1 Instrument in multiple locations + References • n Instruments (types) + References • Application of 3D Measurement Systems • Real use multiple stations and different instruments in the same network • Quantify coordinate data uncertainty fields in a network • Practical methods to estimate the uncertainty of specific systems • Combining measurement systems • Combining measurement uncertainties • Results need to in an easy to understand and meaningful format
Monte Carlo • What: Non-linear statistical technique • Why: Difficult problems and expensive to state or solve • When: Consequences are expensive • How: • List of possible conditions (where the activity being studied is to large or complex to be easily stated) • Random numbers (from estimates of each measured component) • Model of Network … interactions • Large number of solution are run • Statistical inferences are drawn Monte Carlo technique was developed during World War II in Los Alamos for the atom bomb project
Models • Modeling • Instruments • Axes • Angles • Ranging • Offsets • Joins • Measurements • Angles ppm • Ranges ppm + offset • Confidence
Inputs CAD Model includes Features, Relationships, Tolerances Sweep, Dihedral, Incidence Scanners, Trackers, Local GPS, Robotics, Gap Measurement Devices Production Measurement + Analysis < 3 minutes Aluminum Surface Targeted and Pre-measured Assembly Interface Features Transfer critical object control to continuously visible features Outputs Surface: 0.080” @ 2 Features: 0.004” @ 2 2 Scanners + Local GPS + GAP Measurement Tool Optimized Instrument Location Bundle Local GPS and Transfer to (11) Common Pts Local GPS updates at 2 Hz Aerodynamically matched orientation within process uncertainty Wing to Body JoinApplication
Acknowledgements • John Palmateer (Boeing) • Dr. Joe Calkins (New River Kinematics)