Download
1 / 12
120 likes | 257 Views
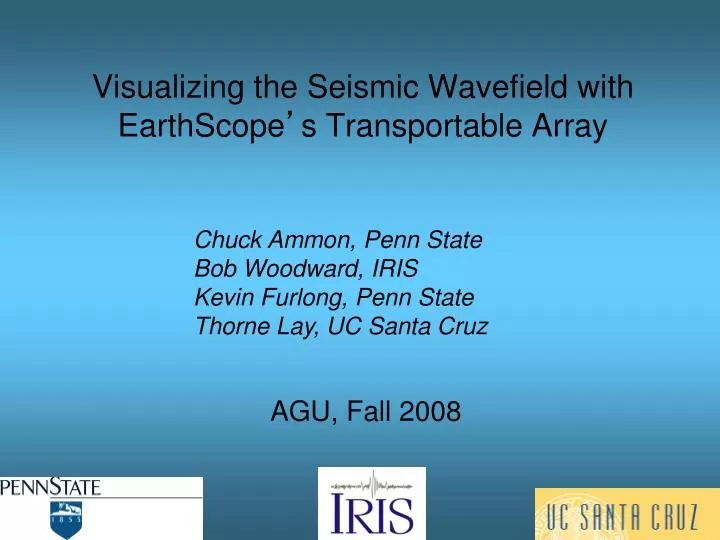
Visualizing the Seismic Wavefield with EarthScope ’ s Transportable Array. Chuck Ammon, Penn State Bob Woodward, IRIS Kevin Furlong, Penn State Thorne Lay, UC Santa Cruz. AGU, Fall 2008. EarthScope USArray Transportable Array.

E N D
Visualizing the Seismic Wavefield with EarthScope’s Transportable Array Chuck Ammon, Penn StateBob Woodward, IRISKevin Furlong, Penn State Thorne Lay, UC Santa Cruz AGU, Fall 2008
EarthScope USArray Transportable Array The Transportable Array will occupy 1600 sites across the contiguous US 2004 2013
Visualizing Seismic Data • “Animate” the ground motion at a seismic station
The Seismic Wavefield • Direct visualization of the wavefield • Direct representation of the data • Data are only bandpass filtered - no other processing
Distance Profile Stations shown in distance profile
Azimuth Profile Stations shown in azimuth profile
Three Component Visualizations Predicted Observed
Tell a Story • The challenge: reach a broader audience • How? • Embed the wavefield animations in a “complete” story • Address basic questions • Where was the earthquake? • How did the energy get to North America • Combine synthesized content with direct representation of the data to tell a story • Represent the physics accurately • Minimize opportunities for muddling the message
Represent Seismicity • Challenge: Represent global seismicity in time and space on an iPhone touchscreen
Summary • Wavefield animations provide a science, education, and outreach tool • Extensions to the basic animations broaden the potential reach, but require care to avoid mis-interpretation • See the IRIS booth for a compilation on CD • Free download of the Epicentral iPhone application • Search for Epicentral on iTunes • More movies on the web • www.iris.edu/hq/resource/earthquake_wave_visualizations • eqseis.geosc.psu.edu/~cammon/QA/