Download
1 / 8
80 likes | 179 Views
havo A 5.1 Stijgen en dalen. ≤ [ ● < ‹ ○. Intervallen. ●. ○. a -8 ≤ x < 3 [ -8 , 3 › b 4 < x ≤ 4½ ‹ 4 , 4½ ] c 5,1 ≤ x ≤ 7,3 [ 5,1 ; 7,3 ] d 3 < x ≤ π ‹ 3 , π ]. l. l. -8. 3. ○. ●. l. l. 4. 4 ½. ●. ●. l.

E N D
≤ [ ● < ‹ ○ Intervallen ● ○ a -8 ≤ x < 3 [ -8 , 3 › b 4 < x ≤ 4½ ‹ 4 , 4½ ] c 5,1 ≤ x ≤ 7,3 [ 5,1 ; 7,3 ] d 3 < x ≤ π ‹ 3 , π ] l l -8 3 ○ ● l l 4 4½ ● ● l l 5,1 7,3 ○ ● l l 3 π
Oneindige intervallen a x ≤ 4½ ‹ , 4½ ] b x > -8 ● l ‹ -8 , › 4½ ○ l -8
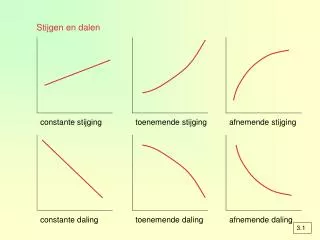
Stijgen en dalen constante stijging toenemende stijging afnemende stijging constante daling toenemende daling afnemende daling
voorbeeld toenemend stijgend op < -4 , -2 > toenemend dalend op < 1 , 3 > afnemend dalend op < -6 , -4 > 5 -6 -4 -2 toenemend stijgend op < 5 , > 1 3 afnemend dalend op < 3 , 5 > afnemend stijgend op < -2 , 1 >
1850 1920 opgave 9 1850 1900 inwoners x miljoen a b 10 9,4 8 3,5 milj 5,5 milj ∆n = 2 x 50 : 70 ∆n = 1,43 in 1850 3,5 milj. dus in 1900 3,5 + 1,43 = 4,93 milj. 6 ● 4 ● ● 2 0 1750 1850 1920 1950 2050 jaar 1920 constante stijging tot 5,5 miljoen 1750 1,5 miljoen 1850 toenemende stijging tot 3,5 miljoen
voorbeeld y1 = -x³ - 1,5x² + 36x + 25 optie max. en min. geven de toppen max. is f(3) = 92,5 ● (3; 92,5) min. is f(-4) = -79 ● (-4, -79)
opgave 13 tijdvereffening = ware – middelbare zonnetijd a tijdvereffening = 0 op 4 dagen april, juni, september en december babs.max. = 17 min. op 3 november abs.min. = -14 min. op 11 februari c horizontale lijn op hoogte 12 minuten snijpunt bij 1 oktober en 30 november dus tussen 1 oktober en 30 november d tijdvereffening = -17 minuten -17 min = 12.00 uur – horlogetijd horlogetijd = 11.43 uur e tijdvereffening = -14 minuten -14 min = 12.00 uur – horlogetijd horlogetijd = 12.14 uur f op 13 juni staat bij de zomertijd de zon om 13.00 uur in de hoogste stand ware zonnetijd = 12.00 uur middelbare zonnetijd = 13.00 uur tijdvereffening = 12 – 13 = -1 uur de grafiek schuift dus 60 minuten naar beneden ● ● ● ● ● 30 1 ● 1 t/m 31 jan.