Download
1 / 29
290 likes | 372 Views
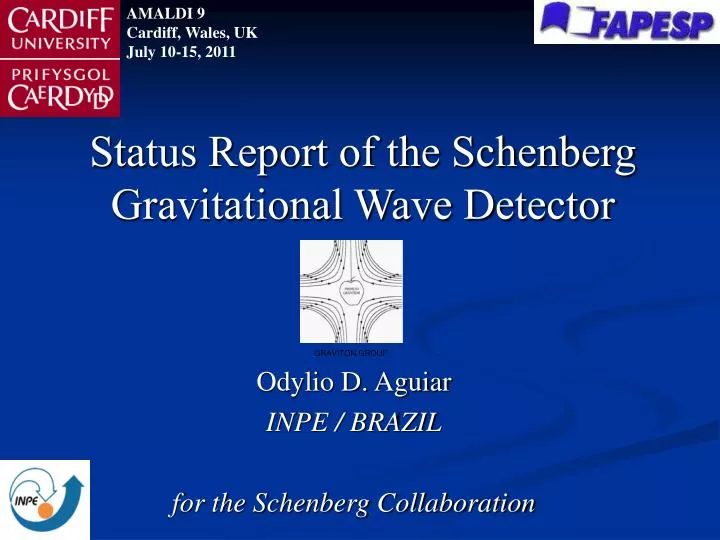
AMALDI 9 Cardiff, Wales, UK July 10-15, 2011. GRAVITON GROUP. Status Report of the Schenberg Gravitational Wave Detector. Odylio D. Aguiar INPE / BRAZIL for the Schenberg Collaboration. GRAVITON GROUP. The Mario SCHENBERG Gravitational Wave Detector

E N D
AMALDI 9 Cardiff, Wales, UK July 10-15, 2011 GRAVITON GROUP Status Report of the Schenberg Gravitational Wave Detector Odylio D. Aguiar INPE / BRAZIL for the Schenberg Collaboration
GRAVITON GROUP The Mario SCHENBERG Gravitational Wave Detector (Brazil) started commissioning operation in the 8th of September, 2006. It involves a collaboration between INPE, USP, ITA, IFSP, UNIFESP, UNIFEI, UNICAMP, UESC, IAE, UFABC, UNIPAMPA, CBPF Leiden University, UWA, LSU, OCA, and it has been supported by
THE SCHENBERG COLLABORATION O D Aguiar 1, J J Barroso 1, N C Carvalho 1, P J Castro 1, C E Cedeño Montaña 1, C F da Silva Costa 1, J C N de Araujo 1, E F D Evangelista 1, S R Furtado 1, O D Miranda 1, P H R S Moraes 1, E S Pereira 1, P R Silveira 1, C Stellati 1, N F Oliveira Jr 2, Xavier Gratens 2, L A N de Paula 2, S T de Souza 2, R M Marinho Jr 3, F G Oliveira 3, C Frajuca 4, F S Bortoli 4, R Pires 4, D F A Bessada 5, N S Magalhães 5, M E S Alves 6, A C Fauth 7, R P Macedo 7, A Saa 7, D B Tavares 7, C S S Brandão 8, L A Andrade 9, G F Marranghello 10, C Chirenti 11, G Frossati 12, A de Waard 12, M E Tobar 13, C A Costa 14, W W Johnson 14, J A de Freitas Pacheco 15, G L Pimentel 16. 1. INPE – Divisão de Astrofísica, São José dos Campos, SP, Brazil, 2. Universidade de São Paulo, Instituto de Física, São Paulo, SP, Brazil, 3. Instituto Tecnológico de Aeronáutica, São José dos Campos, SP, Brazil, 4. Instituto Federal de São Paulo, São Paulo, SP, Brazil, 5. Universidade Federal de São Paulo, Diadema, SP, Brazil, 6. Universidade Federal de Itajubá, Itajubá, MG, Brazil, 7. Universidade de Campinas, Instituto de Física, Campinas, SP, Brazil, 8. Universidade Estadual de Santa Cruz, Ilhéus, BA, Brazil, 9. Instituto de Aeronáutica e Espaço, São José dos Campos, SP, Brazil, 10. Universidade Federal de Pelotas, Pelotas, RS, Brazil, 11. Universidade Federal do ABC, Santo André, SP, Brazil, 12. Leiden University, Kammerlingh Onnes Laboratory, Leiden, The Netherlands, 13. University of Western Australia, Perth, Australia, 14. Louisiana State University, Baton Rouge, USA, 15. Observatoire de la Côte dAzur, Nice, France, 16. Princeton University, Princeton, USA.
(V. Fafone) The Schenberg antenna is the only spherical antenna equipped with a set of parametric transducers for gravitational wave detection.
A schematic view of the detector. The explosive view explains the principle of the two mode resonant transducer coupled to the spherical antenna. 287 kg is the effective mass for each sphere’s quadrupole mode; ( 5 x 287 kg = 1435 kg > 1150 kg = Msphere)
The initial configuration The position on the sphere surface of the three initial transducers can be seen. It is also possible to see the cabling lines going and coming from these transducers and the three cryogenic microwave amplifiers installed close to the bottom wall of the liquid helium reservoir. The schematic diagram of the transducer’s electronic circuit (for one transducer).
Both the carrier and the modulated signal were sent back and forth the transducer by pairs of microstrips antennas. No cables touched the sphere in order to avoid the introduction of sismic noise.
The three initial transducers: Qe ~ 104 First design
Second design Measurement of the mechanical resonance frequency of three transducers. Silicon membranes with a niobium layer deposited by sputtering.
We also measured the electrical Q of many different superconducting klystron cavities at 4.2 K using a liquid helium dewar and an Agilent 8722/ES vectorial network analyzer. Q as high as ~ 300 k were recorded. Experimental apparatus to test superconductive klystron cavities inside a standard liquid helium dewar. Second design
Fourth design Alumina part The new projected transducer. Niobium part
We developed a sapphire oscillator, which operates at 77 K and will replace the current ones thereby providing better performance. Phase noise: inprovement from -100 dBc/Hz -135 dBc/Hz @ 3.2 kHz from carrier
Detail of the 30 SMA vacuum sealed feedthrough connectors and cabling for a complete set of transducers. The infrared reflectors were placed at special positions for heat sinking optimization
Initial Configuration Next Run Configuration
A new set of transducers with better sensitivity would not afford a movable “testbed”, so we needed to immobilize the sphere dewar. Large tubes were constructed as “columns” for the detector concrete base. We also raised the antenna, bringing it to the floor level, for easy assembling.
Computer/gps data acquisition system The helium return line Mezzanine The sphere was raised about 1.5 meters up and immobilized. A wood floor was constructed under it, making the work of assembly easier. Two nine steps “swimming pool” ladder were built for access to the top of the detector.
We are still upgrading the detector (since 2008): • we have installed a dilution refrigerator’s 1K pot; • we have been testing new sets of transducers; • we have completed the design for the new suspension and vibration isolation system for the cabling and microstrip antennas.
We hope to start a run with the new set of resonant transducers soon.
We are also developing the project of an ultra-high sensitivity non-resonant nanogap transducer. In doing so, we want to verify if the Schenberg antenna can become a wideband gravitational wave detector through the use of an ultra-high sensitivity non-resonant transducer constructed by the application of recent achievements of nanotechnology.
287 kg, ~30 g and ~3 mg • amplitude gain ~ 10k • post top diameter of ~ 90 m • fo ~ 10 GHz • df/dx ~ 0.5 GHz / micron • (gap of ~ 2 microns) • Ampl. at surface ~ 10-21 m • ampl. at membrane ~ 10-17 m • change of 5 mHz • or • non-resonant • with df/dx ~ 5 THz / micron • gap of 1 nanometer post top diameter of ~ 50 m
The sensitivity curve for the Schenberg broadband detector using a nanogap klystron cavity non-resonant transducer. The dashed curves represent each of the 6 spheres we chose for the array (masses: 1150 kg (Schenberg), 744 kg, 547 kg, 414 kg, 301 kg, 239 kg), the lowest frequency being Schenberg. The V-shaped red curve is Schenberg with its usual configuration operating at dilution fridge temperatures ( 10 mK). Interferometer curves are also plotted: advanced LIGO (green), LIGO (blue), VIRGO (light blue), TAMA300 (pink) and GEO600 (orange). All of these are project curves, not actual data. by Guilherme L. Pimentel