Download
1 / 4
40 likes | 109 Views
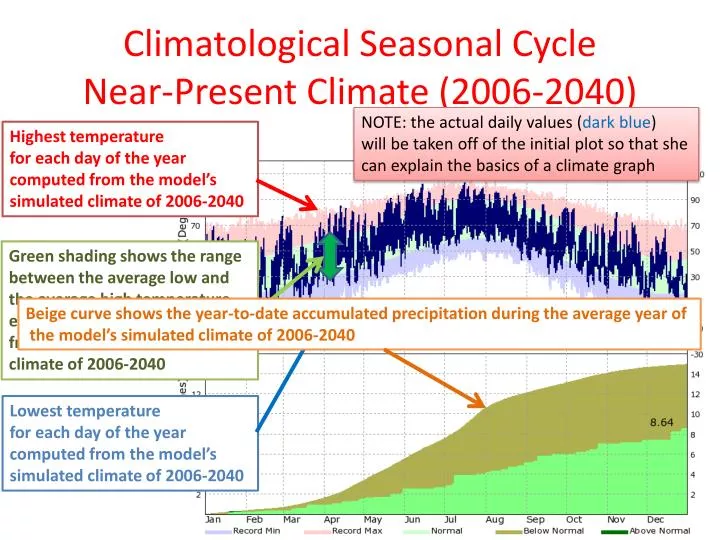
Climatological Seasonal Cycle Near-Present Climate (2006-2040). NOTE: the actual daily values ( dark blue ) will be taken off of the initial plot so that she can explain the basics of a climate graph. Highest temperature for each day of the year computed from the model’s

E N D
Climatological Seasonal CycleNear-Present Climate (2006-2040) NOTE: the actual daily values (dark blue) will be taken off of the initial plot so that she can explain the basics of a climate graph Highest temperature for each day of the year computed from the model’s simulated climate of 2006-2040 Green shading shows the range between the average low and the average high temperature each day of the year, computed from the model’s simulated climate of 2006-2040 Beige curve shows the year-to-date accumulated precipitation during the average year of the model’s simulated climate of 2006-2040 Lowest temperature for each day of the year computed from the model’s simulated climate of 2006-2040
Worst Case Drought Year Near-Present Climate (2006-2040) The daily range of temperature fluctuation for a particular year in the simulation The accumulated rainfall for a particular year in the simulation
We will also provide a plot showing how the climatology shifts between the two periods.