Download
1 / 25
250 likes | 380 Views
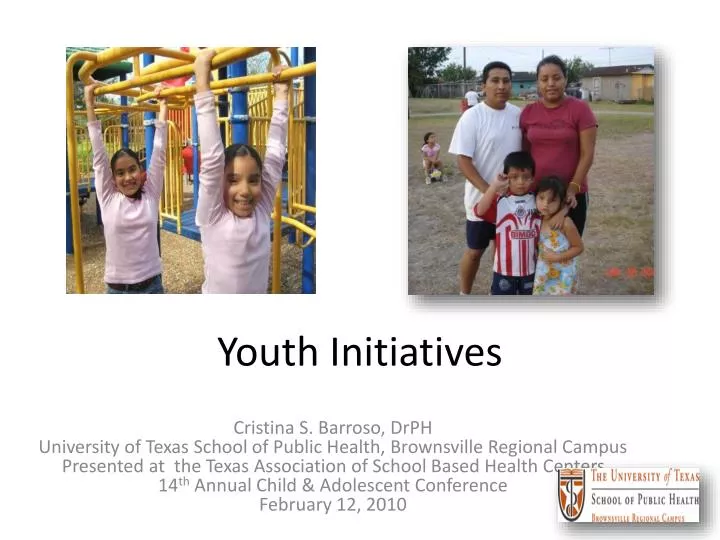
Youth Initiatives. Cristina S. Barroso, DrPH University of Texas School of Public Health, Brownsville Regional Campus Presented at the Texas Association of School Based Health Centers 14 th Annual Child & Adolescent Conference February 12, 2010.

E N D
Youth Initiatives Cristina S. Barroso, DrPH University of Texas School of Public Health, Brownsville Regional Campus Presented at the Texas Association of School Based Health Centers 14th Annual Child & Adolescent Conference February 12, 2010
Children Born Today have a Lower Life Expectancy than their Parents • 1 in 3 will develop diabetes • 3/5 if African American • ½ if Hispanic • > ½ if Native American
Obesity by the Numbers • National Health and Nutrition Examination Survey (NHANES 2007-2008) • 9.5% of infants & toddlers ≥ 95th percentile • 16.9% of children & adolescents ≥ 95th percentile • 11.9% of children & adolescents ≥ 97th percentile BMI = body mass index [weight (kg)/height (m)2] Ogden et al., 2010
Impact of Childhood Obesity on Adult Obesity • One out of four obese adults were overweight children • Onset ≤ 8 years – more severely obese as adults (BMI = 41.7 vs. 34.0) • One-half of adults with BMI ≥ 40 were obese as children Freedman et al. , 2001
Obesity is caused by long-term positive energy balance FatStores ~ 600 calories per day
Toxic Environment • Availability & affordability of high fat/high carbohydrate food (fast food, soft drinks) • Large portion sizes • Marketing to children • Fewer family meals • TV, computers, video games • Safety issue • Decrease in physical education Schwartz MB & Brownell KD, 2007
Dollars Spent on U.S. Food Advertising in 2005 • Food, beverages, candy $7,313,200,000 • Restaurants & fast food $5,061,000,000 Advertising Age, 2006
No Single Intervention will Reverse the Current Trends in Obesity
Legislation & Policy • Passage of Senate Bill 19 9/1/2001 • Daily PE (30 min/d or 135 m/week) 4th grade • School Health Advisory Councils 4th grade • Coordinated School Health Programs (CSHPs) 4th grade (9/1/2007) • Texas Public School Nutrition Policy all grades (8/2004) • Passage of Senate Bill 42 9/1/2005 • CSHP: 6-8th grade (2007-2008 school year)
New Legislation – Senate Bill 530(2007-2008)(Amends Sections 28.002 and 28.004, Education Code) • K-5: 30 minutes/day • 6-8: 30 minutes/day for minimum of 4 semesters • Physical Fitness assessment (Fitnessgram), grades 3-12 • Pacer • Strength & flexibility • SHAC should determine importance of daily recess for elementary school students • SHAC should evaluate CSHP
4th Grade Prevalence of Obesity* by Health Service Region in Texas, SPAN 2000-2002, 2004-2005 2000-2002 2004-2005 *Obesity is > 95th Percentile for BMI by Age/Sex
Texas Senate Bill 42 (SB42) • Awareness of & adherence to SB42 in a representative sample of public middle schools • Impact of SB42 (along Texas-Mexico border): • Frequency of school PE class • Quality of school PE • Prevalence of child self-reported physical activity & child overweight
Are You Aware that SB42 Requires…?2006-2008 , Key Informants
How Did You Become Aware of SB42…?2006-2008 , Key Informants
What type of PE Class Schedule is Followed? 2006-2008 , Key Informants
Self-Reported Structured Physical Activity of 8th Grade Border Students, 2004-2005 & 2006-2008
Self-Reported Structured Physical Activity of 8th Grade Border Students, 2004-2005 and 2006-2008 (±0.15) (±0.0005) (±0.05) (±0.15) *p<0.001; difference between border districts 2004-2005 and border districts 2006-2008
Does CATCH Work? • Reduced total fat and saturated fat content of school lunches • Increased moderate-to-vigorous physical activity (MVPA) during PE classes • Improved students’ self-reported eating and physical activity behaviors • Effects persisted over three years without continued intervention Luepker et al., 1996; Nader et al. ,1999