Download
1 / 1
10 likes | 82 Views
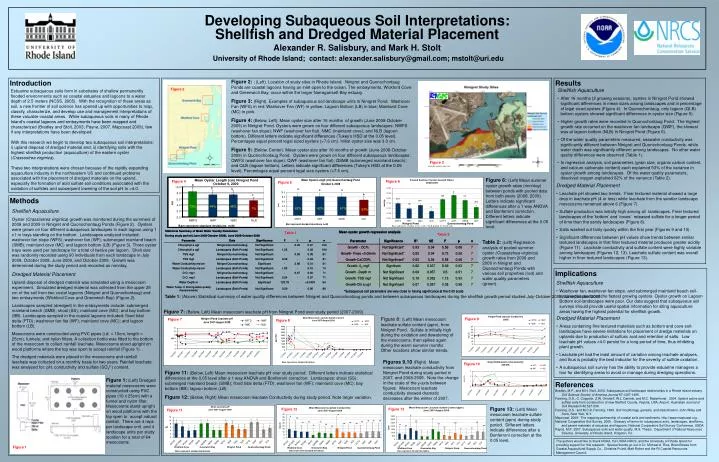
a. b. a. a. a. b. a. a. a. a. a. b. a. b. b. b. b. ab. c. ab. acb. c. c. c. c. c. c. c. ab. ac. c. ac. ab. ac. ac. ac. c. c. c. c. 62%. 62%. 61%. 24%. Wickford Cove. Greenwich Bay. Ninigret Pond. Quonochontaug Pond. Wickford Cove. Greenwich Bay.

E N D
a b a a a b a a a a a b a b b b b ab c ab acb c c c c c c c ab ac c ac ab ac ac ac c c c c 62% 62% 61% 24% Wickford Cove Greenwich Bay Ninigret Pond Quonochontaug Pond Wickford Cove Greenwich Bay Ninigret Pond Quonochontaug Pond Figure 2 Figure 4 Figure 5 Figure 6 d Figure 3 cde cd acd abc abe ab 73% 44% 45% b 1% Mean Oyster Length (cm) Ninigret Pond October 9, 2009 Ninigret Pond Quonochontaug Pond 10.0 8.0 Table 1 6.0 cm 4.0 2.0 0.0 NWFS NWF NMC NLB Bars represent standard deviations, n=90 Figure 9 Figure 7 Figure 8 Figure 10 Figure 13 Figure 11 a a ab ab ab ab ab ab ab ab ab ab ab ab b ab Figure 1 Developing Subaqueous Soil Interpretations: Shellfish and Dredged Material Placement Alexander R. Salisbury, and Mark H. Stolt University of Rhode Island; contact: alexander.salisbury@gmail.com; mstolt@uri.edu Introduction Figure2:: (Left). Location of study sites in Rhode Island. Ninigret and Quonochontaug Ponds are coastal lagoons having an inlet open to the ocean. The embayments, Wickford Cove and Greenwich Bay, occur within the larger Narragansett Bay estuary. Figure 3:(Right). Examples of subaqueous soil-landscape units in Ninigret Pond. Washover Fan (WFS) in red; Washover Fan (WF) in yellow; Lagoon Bottom (LB) in blue; Mainland Cove (MC) in pink. Figure 4: (Below, Left). Mean oyster size after 16 months of growth (June 2008-October 2009) in Ninigret Pond. Oysters were grown on four different subaqueous landscapes: NWFS (washover fan slope); NWF (washover fan flat); NMC (mainland cove); and NLB (lagoon bottom). Different letters indicate significant differences (Tukey’s HSD at the 0.05 level). Percentages equal percent legal sized oysters (>7.6 cm). Initial oyster size was 3.0 cm. Figure 5: (Below, Center). Mean oyster size after 16 months of growth (June 2008-October 2009) in Quonochontaug Pond. Oysters were grown on four different subaqueous landscapes: QWFS (washover fan slope); QWF (washover fan flat); QSMB (submerged mainland beach); and QLB (lagoon bottom). Letters indicate significant differences (Tukey’s HSD at the 0.05 level). Percentages equal percent legal size oysters (>7.6 cm). Results • Shellfish Aquaculture • After 16 months (2 growing seasons), oysters in Ninigret Pond showed significant differences in mean sizes among landscapes and in percentage of legal sized oysters (Figure 4). In Quonochontaug, only lagoon (QLB) bottom oysters showed significant differences in oyster size (Figure 5). • Higher growth rates were recorded in Quonochontaug Pond. The highest growth rate occurred on the washover fan landscape (QWF), the slowest was at lagoon bottom (NLB) in Ninigret Pond (Figure 6). • Of the water quality parameters measured, seawater conductivity was significantly different between Ninigret and Quonochontaug Ponds, while water depth was significantly different among landscapes. No other water quality differences were observed (Table 1). • In regression analysis, soil parameters (grain size, organic carbon content, and calcium carbonate content) each explained 53% of the variance in oyster growth among landscapes. Of the water quality parameters, dissolved oxygen explained 62% of the variance (Table 2). Estuarine subaqueous soils form in substrates of shallow permanently flooded environments such as coastal estuaries and lagoons to a water depth of 2.5 meters (NCSS, 2005). With the recognition of these areas as soil, a new frontier of soil science has opened up with opportunities to map, classify, characterize, and develop use and management interpretations of these valuable coastal areas. While subaqueous soils in many of Rhode Island’s coastal lagoons and embayments have been mapped and characterized (Bradley and Stolt, 2003; Payne, 2007, Mapcoast 2009), few if any interpretations have been developed. With this research we begin to develop two subaqueous soil interpretations: i) upland disposal of dredged material and, ii) identifying soils with the highest shellfish production (aquaculture) of the eastern oyster (Crassostrea virginica). These two interpretations were chosen because of the rapidly expanding aquaculture industry in the northeastern US and continued problems associated with the placement of dredged materials on the upland, especially the formation of acid sulfate soil conditions associated with the oxidation of sulfides and subsequent lowering of the soil pH to <4.0. Figure 6: (Left) Mean summer oyster growth rates (mm/day) between ponds with pooled data from both years (2008, 2009). Letters indicate significant differences after a 1 way ANOVA and Bonferroni correction. Different letters indicate significant differences at the 0.05 level. • Dredged Material Placement • Leachate pH showed two trends. Finer textured material showed a large drop in leachate pH (4 or less) while leachate from the sandier landscape mesocosms remained above 6 (Figure 7). • Sulfate production was initially high among all landscapes. Finer textured landscapes of the ‘bottom’ and ‘coves’ released sulfate for a longer period of time than the sandy landscapes (Figure 8). • Salts washed out fairly quickly within the first year (Figures 9 and 10). • Significant differences between pH values show trends between similar textured landscapes in that finer textured material produces greater acidity (Figure 11). Leachate conductivity and sulfate content were highly variable among landscapes (Figures 12, 13). Leachate sulfate content was overall higher in finer textured landscapes (Figure 13). Methods Shellfish Aquaculture Oyster (Crassostrea virginica) growth was monitored during the summers of 2008 and 2009 in Ninigret and Quonochontaug Ponds (Figure 2). Oysters were grown on four different subaqueous landscapes in each lagoon using 1 x1 m trays standing on the bottom. Landscapes analyzed included: washover fan slope (WFS); washover fan (WF); submerged mainland beach (SMB); mainland cove (MC) and lagoon bottom (LB) (Figure 3). Three oyster trays were used per landscape for a total of twelve per lagoon. Shell size was randomly recorded using 90 individuals from each landscape in July 2008, October 2008, June 2009, and October 2009. Growth was determined during the study period and recorded as mm/day. Table 2 Table 2: (Left) Regression analysis of pooled summer oyster (Crassostrea virginica) growth rates from 2008 and 2009 in Ninigret and Quonochontaug Ponds with various soil properties (red) and water quality parameters (green). Implications Dredged Material Placement Upland disposal of dredged material was simulated using a mesocosm experiment. Simulated dredged material was collected from the upper 25 cm of the soil from two costal lagoons (Ninigret and Quonochontaug) and two embayments (Wickford Cove and Greenwich Bay) (Figure 2). Landscapes sampled (dredged) in the embayments include: submerged mainland beach (SMB); shoal (SS); mainland cove (MC); and bay bottom (BB). Landscapes sampled in the coastal lagoons included: flood tidal delta (FTD); washover fan flat (WF); mainland cove (MC); and lagoon bottom (LB). Mesocosms were constructed using PVC pipes (i.d. = 10cm, length = 25cm), funnels, and nylon filters. A collection bottle was fitted to the bottom of the mesocosm to collect rainfall leachate. Mesocosms stood upright on wood platforms where the top was open to accept rainfall (Figure 1). The dredged materials were placed in the mesocosms and rainfall leachate was collected on a monthly basis for two years. Rainfall leachate was analyzed for: pH, conductivity and sulfate (SO42-) content. • Shellfish Aquaculture • Washover fan, washover fan slope, and submerged mainland beach soil-landscapes produced the fastest growing oysters. Oyster growth on Lagoon Bottom soil-landscapes were poor. Our data suggest that subaqueous soil surveys should provide useful spatial information for siting aquaculture areas having the highest potential for shellfish growth. Table 1: (Above) Statistical summary of water quality differences between Ninigret and Quonochontaug ponds and between subaqueous landscapes during the shellfish growth period studied July-October 2008; June-October 2009. Figure 7: (Below, Left) Mean mesocosm leachate pH from Ninigret Pond over study period (2007-2009). • Dredged Material Placement • Areas containing fine textured materials such as bottom and cove soil-landscapes have severe limitations for placement of dredge materials on uplands due to production of sulfuric acid and retention of salts. Low leachate pH values <4.0 persist for a long period of time, thus inhibiting plant growth. • Leachate pH had the least amount of variation among leachate analyses, and thus is probably the best indicator for the severity of sulfide oxidation. • A subaqueous soil survey has the ability to provide estuarine managers a tool for identifying areas to avoid or manage during dredging operations. Figure 8: (Left) Mean mesocosm leachate sulfate content (ppm), from Ninigret Pond. Sulfate is initially high during the oxidation and dewatering of the mesocosms, then spikes again during the warm summer months. Other locations show similar trends. Figures 9,10 (Right) Mean mesocosm leachate conductivity from Ninigret Pond during study period in 2007, and 2008-2009. Note the change in the scale of the y-axis between figures. Mesocosm leachate conductivity showed dramatic decreases after the winter of 2007. Figure 11: (Below, Left) Mean mesocosm leachate pH over study period. Different letters indicate statistical differences at the 0.05 level after a 1 way ANOVA and Bonferroni correction. Landscapes: shoal (SS); submerged mainland beach (SMB); flood tidal delta (FTD); washover fan (WF); mainland cove (MC); bay bottom (BB); lagoon bottom (LB). Figure 12: (Below, Right) Mean mesocosm leachate Conductivity during study period. Note larger variation. Figure 1:(Left) Dredged material mesocosms were constructed using PVC pipes (10 x 25cm) with a funnel and nylon filter. Mesocosms stand upright on wood platforms with the top open to accept natural rainfall. There are 4 reps per landscape unit and 4 landscape units per study location for a total of 64 mesocosms. References Bradley, M.P., and M.H. Stolt. 2003. Subaqueous soil-landscape relationships in a Rhode Island estuary. Soil Science Society of America Journal 67:1487-1495. Fanning, D.S., C. Coppock, Z.W. Orndorff, W.L. Daniels, and M.C. Rabenhorst. 2004. Upland active acid sulfate soils from construction of new Stafford County, Virginia, USA, Airport. Australian Journal of Soil Research 42:527-536. Fanning, D.S., and M.C.B. Fanning. 1989. Soil morphology, genesis, and classification. John Wiley and Sons, New York, N.Y. Mapcoast. 2009. The mapping partnership of coastal soils and sediments. http://www.mapcoast.org. National Cooperative Soil Survey. 2005. Glossary of terms for subaqueous soils, landscapes, landforms, and parent materials of estuaries and lagoons. National Cooperative Soil Survey Conference, USDA. Payne, M.K. 2007. Subaqueous soils and water quality. M.S. Thesis. Department of Natural Resources Science. University of Rhode Island, Kingston, R.I. Figure 13: (Left) Mean mesocosm leachate sulfate content (ppm) during study period. Different letters indicate differences after a Bonferroni correction at the 0.05 level. Figure 12 The authors would like to thank NOAA, the USDA-NRCS, and the University of Rhode Island for providing support for this research. Special thanks go out to Dr. Michael A. Rice, Brian Bowes from Coastal Aquacultural Supply Co., Christina Pruett, Matt Ricker and the RI Coastal Resources Management Council. Wickford Cove Greenwich Bay Ninigret Pond Quonochontaug Pond