Download

1 / 43
430 likes | 559 Views
Human impacts on the hydrologic cycle. Qiuhong Tang 08/19/2010 Department of Civil & Environmental Engineering University of Washington, Seattle qiuhong@hydro.washington.edu. The Problem: The hydrologic cycle is changing everywhere.

E N D
Human impacts on the hydrologic cycle Qiuhong Tang 08/19/2010 Department of Civil & Environmental Engineering University of Washington, Seattle qiuhong@hydro.washington.edu
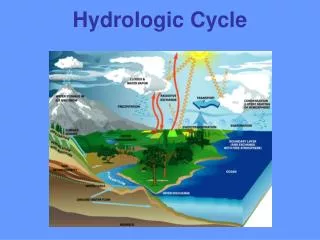
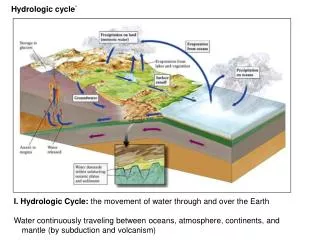
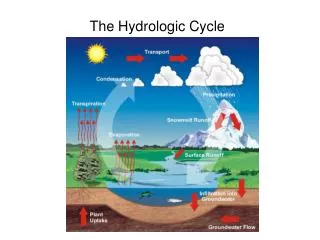
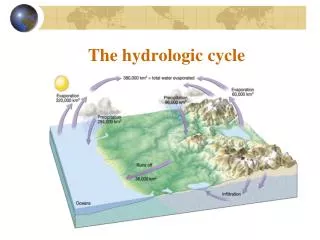
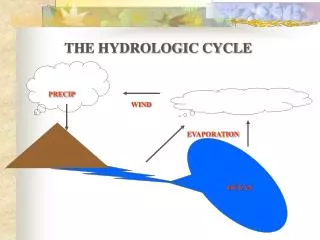
The Problem: The hydrologic cycle is changing everywhere. “You can't step into the same river twice.” -- Heraclitus WHY? How humans affect the hydrologic cycle?
Humans have influenced 83% of Earth’s land surface Little Impact Heavy Impact
Source: Igor A. Shiklomanov, State Hydrological Institute (SHI), 1999; Howell 2000 via direct alteration of the terrestrial water cycle for human needs Source: Nilsson et al, 2005 Red: HeavyYellow: ModerateGreen: Little Impact
Ice core CO2 concentration Temperature Source: Cuffey and Vimeux 2001 Source: Hansen et al. 2001 1951–1980 Surface Obv. Model Source: CDIAC CO2 Emission Population
CO2 N2O CH4 Water vapour and rainfall Changes in circulation via indirect influences on Earth’s climate system Human Activities: Fossil fuel burning: Industry, Heating, Transport, … Climate Change Processes: Enhanced greenhouse effect, Temperature rise, Sea level rise Effects of Climate Change on the Hydrologic Cycle: Change in Precipitation, Evaporation, Runoff Effects on Hydrology at Regional Scale: Drought, Flooding, Groundwater Depletion, Ecosystem
Climate System Human Local effects Global effects Hydrologic Cycle at Regional Scale
Global effectsGlobal changes in the hydrologic cycle as affected by humans
Changes in precipitation: Observation & GCM GCM ensemble mean (50 IPCC simulations) GHCN Observation Source: Zhang et al. 2007
GCM ensemble (IPCC AR4 21 GCMs) GCM ensemble median P Change (%) Q-Q plot Changes in precipitation (1950-2000) Observations GHCN P Change (%) NCAR P Change (%) Source: Dai et al. 2004; Tang et al. 2010
Q-Q plot Changes in evaporation (1950-2000) Observation-based GCM ensemble CLM E Change (%) GCM ensemble median E Change (%) The pattern amplitude is significantly underestimated by the GCM ensemble method. Source: Tang et al. 2010
Q-Q plot Changes in runoff (1950-2000) Observation-based CLM + Observation R Change (%) GCM ensemble Spatial variability in GCM ensemble runoff change is only 20% of that in the observation. GCM ensemble median R Change (%) Source: Tang et al. 2010
Ensemble (mean or median) method Colorado River: GCM ensemble (19 GCMs) Single GCM 75th percentiles median 25th percentiles Reduce uncertainty of single-models for a M-member ensemble Reduce the variance
Scaled GCM ensemble: GCM vs Observation (1950-2000) Observation Observation-based estimates Precipitation Scaled GCM ensemble Single GCM GCM ensemble median Evaporation The scaled GCM ensemble estimation gives the ‘best guess’. The relationship developed in the period of 1950-2000 can be used to constrain future projections. Runoff
Arid belt Humid belt Precipitation change projections 20th Century 21st Century More dramatic change in the hydrologic cycle is expected at regional scale with climate change. The arid area may become drier and humid area may become wetter.
Evaporation change projections 20th Century 21st Century Evaporation may increase over most of the land area in the 21st century. The increase in evaporation over large land area is likely due to surface warming.
Drier Drier Drier Wetter Runoff change projections 20th Century 21st Century The spatial pattern of the change in runoff is generally consistent with that in precipitation. The change magnitude in runoff is larger than that in precipitation and evaporation.
Local effects Potential implications for future regional hydrologic cycle
Observed changes in regional hydrologic regimes 20th: Drier 21st: Drier 20th: Drier 21st: Wetter Source: YRC; Tang et al. 2008 Source: USGS; Tang et al. 2009
Monsoon Drying days (zero low) Source: YRC; Yang et al. 2004 Yellow River 'drying up' North China Plain Red -crowned Crane Huang et al. 2009
Monsoon Direct (local) or indirect (global) influences? Change in Temperature Change in Precipitation How large portion should the drying phenomenon be attributed to local human activities or climate fluctuations? Source: Tang et al. 2008
Offline hydrological model Distributed Biosphere-Hydrologic (DBH) Model Simple Biosphere Model I River Routing Scheme II Irrigation Module Source: Tang et al. 2006 The DBH model represents both natural hydrologic processes and human disturbances. III
DBH model in the Yellow River Basin 794,712 km2 It simulates the hydrologic processes of the real world. The simulated streamflow is comparable with the observed flow, NOT so-called naturalized runoff (removing the effect of water management). Photo credit: Sina, Hudong wiki, Yellowriver.gov.cn
DBH model validation Irrigation Water Withdrawals Simulated streamflow vs observations (1960-2000)
TDG LJ QTX HYK SMX LZ TNH LM Human disturbances on hydrologic regime Observed With Irrigation 40% Without Irrigation increasing Streamflow decreasing along the river from upstream to downstream 60% decreasing From upstream to downstream Source: Tang et al. 2007 Evaporation increases Surface temperature decreases AVG ID IF3 MAX MIN AVG ID IF3 MAX MIN -0.1 -0.32 -0.4 0 -1.6 2.1 6.9 10.5 22 0 Averaged (AVG) In Irrigation Districts (ID) Irrigated Fraction>0.3(IF3) MAXimum MINimum
Contribution Detect the influences from climate change and irrigation Precipitation - detrend Irrigated Area Streamflow
Simulated Changes from 1960 to 2000 Runoff change ET change Surface T change Irrigation change Source: Tang et al. 2008
Influences of Climate Fluctuations and Human Activities Runoff changes contributed by climate change Evaporation changes contributed by irrigation From upstream to downstream Streamflow changes contributed by climate change, human activities, and vegetation change Source: Tang et al. 2008
The future of the Yellow River 20th century 21st century Precipitation change Precipitation change GCM climate projections from the IPCC show that the Yellow River basin may become wetter. Evaporation change Evaporation change The drying trend of the past 50 years may reverse. Runoff change Runoff change Source: Tang et al. 2010
Implications of GCM projection in the Yellow River basin Stalagmite record. Source: Zhang et al. 2008 Future: 2090s Past: 1960s Present: 1990s From upstream to downstream Year (AD); Dynasties in Chinese history More summer monsoon rainfall and a warmer and wetter North China Plain – a bright future. Weak monsoon: Popular unrest Strong monsoon: Increased rice cultivation and population
After Dustbowl Klamath Basin water crisis Tule Lake 1905 2000 2001 Before 40,632 km2 Dead Fish in the Klamath River in September 2002 June 14, 2000 June 17, 2001 Banning water withdrawal by a federal judge Photo credit: klamathbasincrisis.org; Joseph C. Greene
Upstream Rivers Lake Klamath Fall Irrigation Area Who kills salmon? Dead fish is tied to low water flows and water level of the Upper Klamath Lake -- CA Department of Fish and Game Open water area of the Upper Klamath Lake: 270 km2 Source: Tang et al. 2009
VIC model in the Klamath Basin Period: 1950-2005; Temporal step: daily; Spatial resolution: 1/16 degree Liang et al. 1994; Haddeland et al. 2006; Bowling and Lettenmaier 2010
VIC estimated evaporation Open Water Irrigated Land Irrigation
Impacts of irrigation on water depth and discharge Water depth Klamath fall flow
Impacts of irrigation in the low flow season Water depth in Oct Klamath fall flow in Oct 0.1 m 0.4 m 10 m3/s 18 m3/s
sustainable unsustainable The future of the Klamath River 20th century 21st century Precipitation Precipitation Evaporation Evaporation Runoff Runoff Past Present Future
Summary and Conclusions • Changes in regional hydrologic regimes may interact with regional and global changes. • Observations in the 20th century were used to constrain GCM projections in the 21st century. The results showed that more dramatic changes were expected at regional scale. • Future changes in different regions could be quite different. Observed historical changes on the local hydrologic cycle may be either reversed or amplified by human-induced climate change. • It suggests that future assessments of changes in regional hydrology should take into account both local and global influences.
8 GCMs ensemble mean NCAR CCSM3 + RegCM3 Caveats Spatial resolution of the model girds Current GCMs are challenged by fine-scale climate processes. Selecting GCMs for regional studies Different GCM may give different results. Source: Bureau of Meteorology, Australia Ashfaq et al. 2009 Ueda et al. 2006 mm/day
Future directions GCM boxes cannot represent fully the topography – mountains and lakes
Acknowledgements (not a full list, listed in a random order)