Download
1 / 1
10 likes | 85 Views
Drought Sensitivity of Slash Pine and Longleaf Pine Deduced by Tree Ring Analysis Conor Madison * , Heidi Asbjornsen and Rossella Guerrieri Natural Resources, Environmental Science University of New Hampshire, Durham, NH * conormadison9@gmail.com. Introduction. Methods.

E N D
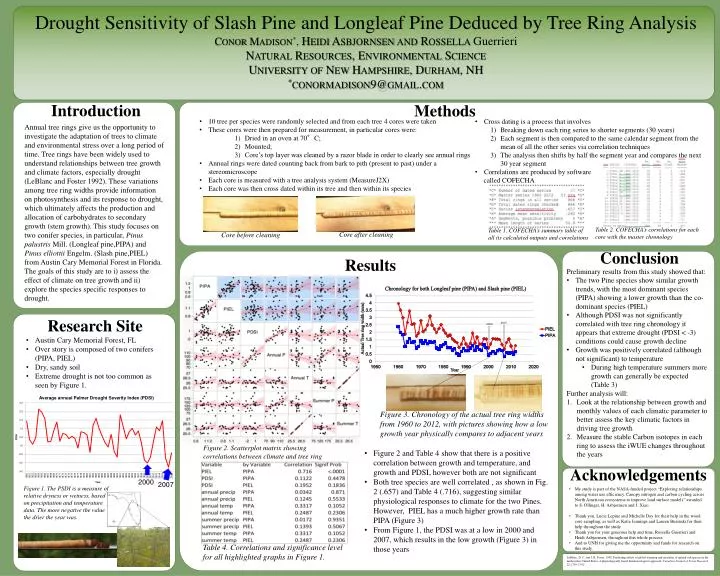
Drought Sensitivity of Slash Pine and Longleaf Pine Deduced by Tree Ring AnalysisConor Madison*, Heidi Asbjornsen and RossellaGuerrieri Natural Resources, Environmental Science University of New Hampshire, Durham, NH *conormadison9@gmail.com Introduction Methods • 10 tree per species were randomly selected and from each tree 4 cores were taken • These cores were then prepared for measurement, in particular cores were: • Dried in an oven at 70°C; • Mounted; • Core’s top layer was cleaned by a razor blade in order to clearly see annual rings • Annual rings were dated counting back from bark to pith (present to past) under a stereomicroscope • Each core is measured with a tree analysis system (MeasureJ2X) • Each core was then cross dated within its tree and then within its species • Cross dating is a process that involves • Breaking down each ring series to shorter segments (30 years) • Each segment is then compared to the same calendar segment from the mean of all the other series via correlation techniques • The analysis then shifts by half the segment year and compares the next 30 year segment • Correlations are produced by software • called COFECHA Annual tree rings give us the opportunity to investigate the adaptation of trees to climate and environmental stress over a long period of time. Tree rings have been widely used to understand relationships between tree growth and climate factors, especially drought (LeBlanc and Foster 1992). These variations among tree ring widths provide information on photosynthesis and its response to drought, which ultimately affects the production and allocation of carbohydrates to secondary growth (stem growth). This study focuses on two conifer species, in particular, Pinus palustris Mill. (Longleaf pine,PIPA) and Pinus elliottii Engelm. (Slash pine,PIEL) from Austin Cary Memorial Forest in Florida. The goals of this study are to i) assess the effect of climate on tree growth and ii) explore the species specific responses to drought. Table 2. COFECHA’s correlations for each core with the master chronology Table 1. COFECHA’s summary table of all its calculated outputs and correlations Core after cleaning Core before cleaning Conclusion Results • Preliminary results from this study showed that: • The two Pine species show similar growth trends, with the most dominant species (PIPA) showing a lower growth than the co-dominant species (PIEL) • Although PDSI was not significantly correlated with tree ring chronology it appears that extreme drought (PDSI < -3) conditions could cause growth decline • Growth was positively correlated (although not significant) to temperature • During high temperature summers more growth can generally be expected (Table 3) • Further analysis will: • Look at the relationship between growth and monthly values of each climatic parameter to better assess the key climatic factors in driving tree growth • Measure the stable Carbon isotopes in each ring to assess the iWUE changes throughout the years Research Site • Austin Cary Memorial Forest, FL • Over story is composed of two conifers (PIPA, PIEL) • Dry, sandy soil • Extreme drought is not too common as seen by Figure 1. Figure 3. Chronology of the actual tree ring widths from 1960 to 2012, with pictures showing how a low growth year physically compares to adjacent years Figure 2. Scatterplot matrix showing correlations between climate and tree ring widths (highlighted graphs) • Figure 2 and Table 4 show that there is a positive correlation between growth and temperature, and growth and PDSI, however both are not significant • Both tree species are well correlated , as shown in Fig. 2 (.657) and Table 4 (.716), suggesting similar physiological responses to climate for the two Pines. However, PIEL has a much higher growth rate than PIPA (Figure 3) • From Figure 1, the PDSI was at a low in 2000 and 2007, which results in the low growth (Figure 3) in those years Acknowledgements 2000 2007 Figure 1. The PSDI is a measure of relative dryness or wetness, based on precipitation and temperature data. The more negative the value the drier the year was. • My study is part of the NASA-funded project “Exploring relationships among water use efficiency. Canopy nitrogen and carbon cycling across North American ecosystems to improve land surface models” awarded to S. Ollinger, H. Asbjornsen and J. Xiao. • Thank you, Lucie Lepine and Michelle Day for their help in the wood core sampling, as well as Katie Jennings and Lauren Buzinski for their help throughout the study • Thank you for your generous help and time, Rossella Guerrieri and Heidi Asbjornsen, throughout this whole process • And to UNH for giving me the opportunity and funds for research on this study. Table 4. Correlations and significance level for all highlighted graphs in Figure 1. LeBlanc, D. C. and J. R. Foster. 1992. Predicting effects of global warming and mortality of upland oak species in the midwestern United States: A physiologically based dendroecological approach. Canadian Journal of Forest Research 22:1739–1752.