Download
1 / 1
10 likes | 149 Views
Intraday Pattern in the Cross-Section of Stock Returns. Team Advisor: Dr. Shijie Deng. Jinsoo Park jpark377@gatech.edu Shangjia Wang wangsj@gatech.edu Quantitative and Computational Finance. Electricity Price Prediction Using Logistic Smooth Transition Regression. 4:00pm. 9:30am.

E N D
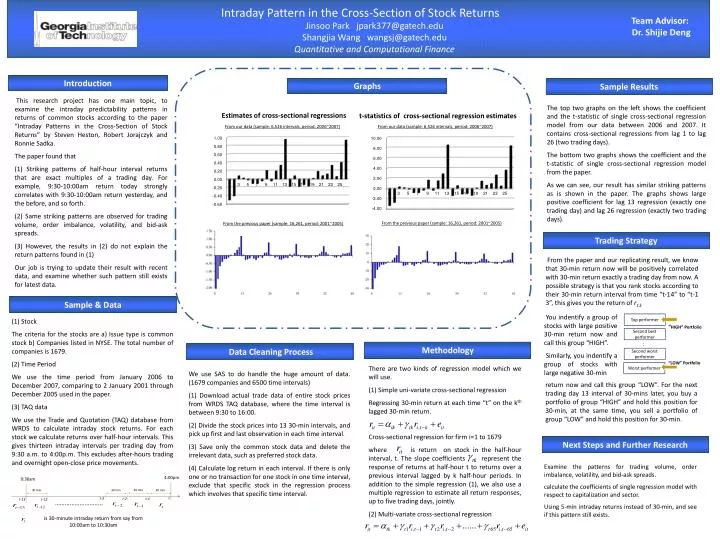
Intraday Pattern in the Cross-Section of Stock Returns Team Advisor: Dr. Shijie Deng Jinsoo Park jpark377@gatech.edu Shangjia Wang wangsj@gatech.edu Quantitative and Computational Finance Electricity Price Prediction Using Logistic Smooth Transition Regression 4:00pm 9:30am Top performer 30 min 30 min 30 min 30 min “HIGH” Portfolio Second best performer t t-3 t-2 t-1 t-13 t-12 Introduction ……………………….. Sample Results Graphs : Second worst performer • This research project has one main topic, to examine the intraday predictability patterns in returns of common stocks according to the paper “Intraday Patterns in the Cross-Section of Stock Returns” by Steven Heston, Robert Jorajczyk and Ronnie Sadka. • The paper found that • (1) Striking patterns of half-hour interval returns that are exact multiples of a trading day. For example, 9:30-10:00am return today strongly correlates with 9:30-10:00am return yesterday, and the before, and so forth. • (2) Same striking patterns are observed for trading volume, order imbalance, volatility, and bid-ask spreads. • (3) However, the results in (2) do not explain the return patterns found in (1) • Our job is trying to update their result with recent data, and examine whether such pattern still exists for latest data. “LOW” Portfolio The top two graphs on the left shows the coefficient and the t-statistic of single cross-sectional regression model from our data between 2006 and 2007. It contains cross-sectional regressions from lag 1 to lag 26 (two trading days). The bottom two graphs shows the coefficient and the t-statistic of single cross-sectional regression model from the paper. As we can see, our result has similar striking patterns as is shown in the paper. The graphs shows large positive coefficient for lag 13 regression (exactly one trading day) and lag 26 regression (exactly two trading days). Worst performer Estimates of cross-sectional regressions t-statistics of cross-sectional regression estimates From our data (sample: 6,526 intervals, period: 2006~2007) From our data (sample: 6,526 intervals, period: 2006~2007) From the previous paper (sample: 16,261, period: 2001~2005) From the previous paper (sample: 16,261, period: 2001~2005) Trading Strategy From the paper and our replicating result, we know that 30-min return now will be positively correlated with 30-min return exactly a trading day from now. A possible strategy is that you rank stocks according to their 30-min return interval from time “t-14” to “t-13”, this gives you the return of r13. Sample & Data • (1) Stock • The criteria for the stocks are a) Issue type is common stock b) Companies listed in NYSE. The total number of companies is 1679. • (2) Time Period • We use the time period from January 2006 to December 2007, comparing to 2 January 2001 through December 2005 used in the paper. • (3) TAQ data • We use the Trade and Quotation (TAQ) database from WRDS to calculate intraday stock returns. For each stock we calculate returns over half-hour intervals. This gives thirteen intraday intervals per trading day from 9:30 a.m. to 4:00p.m. This excludes after-hours trading and overnight open-close price movements. You indentify a group of stocks with large positive 30-min return now and call this group “HIGH”. Similarly, you indentify a group of stocks with large negative 30-min Methodology Data Cleaning Process There are two kinds of regression model which we will use. (1) Simple uni-variate cross-sectional regression Regressing 30-min return at each time “t” on the kth lagged 30-min return. Cross-sectional regression for firm i=1 to 1679 where is return on stock in the half-hour interval, t. The slope coefficients represent the response of returns at half-hour t to returns over a previous interval lagged by k half-hour periods. In addition to the simple regression (1), we also use a multiple regression to estimate all return responses, up to five trading days, jointly. (2) Multi-variate cross-sectional regression • We use SAS to do handle the huge amount of data. (1679 companies and 6500 time intervals) • (1) Download actual trade data of entire stock prices from WRDS TAQ database, where the time interval is between 9:30 to 16:00. • (2) Divide the stock prices into 13 30-min intervals, and pick up first and last observation in each time interval. • (3) Save only the common stock data and delete the irrelevant data, such as preferred stock data. • (4) Calculate log return in each interval. If there is only one or no transaction for one stock in one time interval, exclude that specific stock in the regression process which involves that specific time interval. return now and call this group “LOW”. For the nexttrading day 13 interval of 30-mins later, you buy a portfolio of group “HIGH” and hold this position for 30-min, at the same time, you sell a portfolio of group “LOW” and hold this position for 30-min. Next Steps and Further Research Examine the patterns for trading volume, order imbalance, volatility, and bid-ask spreads. calculate the coefficients of single regression model with respect to capitalization and sector. Using 5-min intraday returns instead of 30-min, and see if this pattern still exists. is 30-minute intraday return from say from 10:00am to 10:30am