Download
1 / 22
220 likes | 318 Views
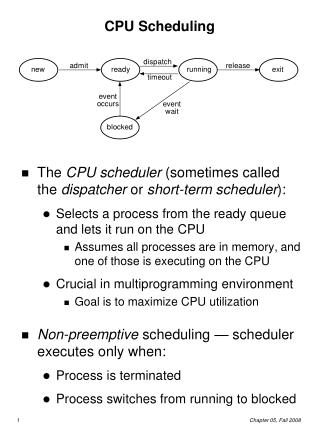
CPU scheduling. Introduction to Operating Systems: Supplemental Module. The processes. Arrival time. CPU burst. 0 13 16 20. P1: 4 36 8 112 1. I/O burst. P2: 23 40 2. P3: 4 20 112 40 2 40 2 40 1. P4: 2 150 3 10 1. Gantt chart. 0. FCFS. 0 13 16 20.

E N D
CPU scheduling Introduction to Operating Systems: Supplemental Module
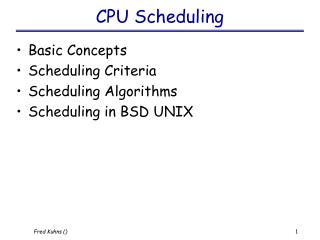
The processes Arrival time CPU burst 0 13 16 20 P1: 4 36 8 112 1 I/O burst P2: 23 40 2 P3: 4 20 112 40 2 40 2 40 1 P4: 2 150 3 10 1 Gantt chart 0
FCFS 0 13 16 20 P1: 4 36 8 112 1 P2: 23 40 2 P3: 4 20 112 40 2 40 2 40 1 P4: 2 150 3 10 1 Which process goes next? Gantt chart P1 idle P2 P3 P4 0 4 13 36 40 42
FCFS Time next ready 40 76 60 192 0 13 16 20 P1: 4 36 8 112 1 P2: 23 40 2 P3: 4 20 112 40 2 40 2 40 1 P4: 2 150 3 10 1 Which process goes next? Gantt chart P1 idle P2 P3 P4 0 4 13 36 40 42
FCFS Time next ready 40 76 60 192 0 13 16 20 P1: 4 36 8 112 1 P2: 23 40 2 P3: 4 20 112 40 2 40 2 40 1 P4: 2 150 3 10 1 Gantt chart P1 idle P2 P3 P4 P1 idle P3 0 4 13 36 40 42 50 60 172
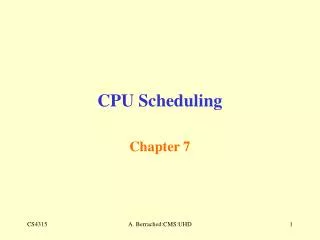
FCFS 162 76 212 192 0 13 16 20 P1: 4 36 8 112 1 P2: 23 40 2 P3: 4 20 112 40 2 40 2 40 1 P4: 2 150 3 10 1 Gantt chart P1 idle P2 P3 P4 P1 idle P3 P2 P1 idle P4 0 4 13 36 40 42 50 60 172 174 175 192
SRTF 0 13 16 20 P1: 4 36 8 112 1 P2: 23 40 2 P3: 4 20 112 40 2 40 2 40 1 P4: 2 150 3 10 1 Which process goes next, and when? Gantt chart P1 idle P2 P3 P4 P2 0 4 13 16 20 22
SRTF Time next ready 40 Run 40 172 0 13 16 20 P1: 4 36 8 112 1 P2: 23 40 2 P3: 4 20 112 40 2 40 2 40 1 P4: 2 150 3 10 1 Gantt chart P1 idle P2 P3 P4 P2 0 4 13 16 20 22
SRTF 162 End Run 172 0 13 16 20 P1: 4 36 8 112 1 P2: 23 40 2 P3: 4 20 112 40 2 40 2 40 1 P4: 2 150 3 10 1 Which process goes next, and when? Gantt chart P1 idle P2 P3 P4 P2 P1 P3 P2 P3 0 4 13 16 20 22 42 50 82 84
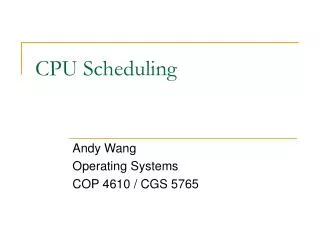
SRTF End End 205 185 0 13 16 20 P1: 4 36 8 112 1 P2: 23 40 2 P3: 4 20 112 40 2 40 2 40 1 P4: 2 150 3 10 1 Gantt chart P1 idle P2 P3 P4 P2 P1 P3 P2 P3 P1 P3 idle P4 0 4 13 16 20 22 42 50 82 84 162 163 165 172 175
RR, Q = 10 0 13 16 20 P1: 4 36 8 112 1 P2: 23 40 2 P3: 4 20 112 40 2 40 2 40 1 P4: 2 150 3 10 1 Which process goes next, and when? Gantt chart P1 idle P2 P3 P4 0 4 13 23 27 29
RR, Q = 10 40 82 47 179 0 13 16 20 P1: 4 36 8 112 1 P2: 23 40 2 P3: 4 20 112 40 2 40 2 40 1 P4: 2 150 3 10 1 Gantt chart P1 idle P2 P3 P4 P2 0 4 13 23 27 29 42
RR, Q = 10 162 End Run 179 0 13 16 20 P1: 4 36 8 112 1 P2: 23 40 2 P3: 4 20 112 40 2 40 2 40 1 P4: 2 150 3 10 1 Gantt chart P1 idle P2 P3 P4 P2 P1 P3 P2 P3 0 4 13 23 27 29 42 50 90 92
RR, Q = 10 End End 205 179 0 13 16 20 P1: 4 36 8 112 1 P2: 23 40 2 P3: 4 20 112 40 2 40 2 40 1 P4: 2 150 3 10 1 Gantt chart P1 idle P2 P3 P4 P2 P1 P3 P2 P3 P1 P3 idle 0 4 13 23 27 29 42 50 90 92 162 163 165
HRRN RR3 = 1+ (36-16)/4 = 6 40 76 0 13 16 20 P1: 4 36 8 112 1 RR4 = 1+ (36-20)/2 = 9 P2: 23 40 2 P3: 4 20 112 40 2 40 2 40 1 P4: 2 150 3 10 1 Gantt chart 1 idle 2 0 4 13 36
HRRN 40 76 62 188 0 13 16 20 P1: 4 36 8 112 1 P2: 23 40 2 P3: 4 20 112 40 2 40 2 40 1 P4: 2 150 3 10 1 Gantt chart 1 idle 2 4 3 0 4 13 36 38 42
HRRN RR1 = 1+ (174-162)/1 = 13 162 76 214 188 0 13 16 20 P1: 4 36 8 112 1 RR2 = 1+ (174-76)/2 = 50 P2: 23 40 2 P3: 4 20 112 40 2 40 2 40 1 P4: 2 150 3 10 1 Gantt chart 1 idle 2 4 3 1 idle 3 0 4 13 36 38 42 50 62 174
HRRN end end 214 end 0 13 16 20 P1: 4 36 8 112 1 P2: 23 40 2 P3: 4 20 112 40 2 40 2 40 1 P4: 2 150 3 10 1 Gantt chart 1 idle 2 4 3 1 idle 3 2 1 idle 4 idle 4 0 4 13 36 38 42 50 62 174 176 177 188 191 201
MLFQ: Q0 = 8, Q1 = 16, Q2 = 40 q1 45 177 0 13 16 20 P1: 4 36 8 112 1 P2: 23 40 2 15 P3: 4 20 112 40 2 40 2 40 1 P4: 2 150 3 10 1 Gantt chart 1 idle 2 3 4 2 0 4 13 21 25 27
MLFQ: Q0 = 8, Q1 = 16, Q2 = 160 q1 q1 177 0 13 16 20 P1: 4 36 8 112 1 P2: 23 40 2 2 P3: 4 20 112 40 2 40 2 40 1 104 P4: 2 150 3 10 1 Gantt chart 1 idle 2 3 4 2 1 3 0 4 13 21 25 27 40 48 56
MLFQ: Q0 = 8, Q1 = 16, Q2 = 160 98 q2 177 0 13 16 20 P1: 4 36 8 112 1 P2: 23 40 2 P3: 4 20 112 40 2 40 2 40 1 64 P4: 2 150 3 10 1 Gantt chart 1 idle 2 3 4 2 1 3 2 3 0 4 13 21 25 27 40 48 56 58 98
MLFQ: Q0 = 8, Q1 = 16, Q2 = end end q2 190 0 13 16 20 P1: 4 36 8 112 1 P2: 23 40 2 P3: 4 20 112 40 2 40 2 40 1 4 P4: 2 150 3 10 1 Gantt chart 1 idle 2 3 4 2 1 3 2 3 2 3 1 3 idle 0 4 13 21 25 27 40 48 56 58 98 100 160 161 165