Download
1 / 15
160 likes | 313 Views
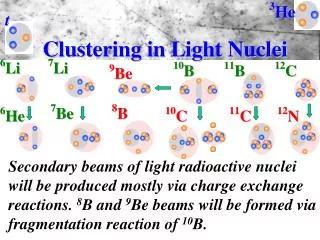
Cluster Evaluation. Metrics that can be used to evaluate the quality of a set of document clusters. Precision Recall & FScore. From Zhao and Karypis, 2002 These metrics are computed for every (class,cluster) pair. Terms: class L r of size n r cluster S i if size n i

E N D
Cluster Evaluation Metrics that can be used to evaluate the quality of a set of document clusters.
Precision Recall & FScore • From Zhao and Karypis, 2002 • These metrics are computed for every (class,cluster) pair. • Terms: • class Lr of size nr • cluster Si if size ni • nri documents in Si from class Lr
Precision • Loosely equated to accuracy • Roughly answers the question: “How many of the documents in this cluster belong there?” • P(Lr, Si) = nri/ni
Recall • Roughly answers the question: “Did all of the documents that belong in this cluster make it in?” • P(Lr, Si) = nri/nr
FScore • Harmonic Mean of Precision and Recall • Tries to give a good combination of the other 2 metrics • Calculated with the equation:
FScore - Entire Solution • We calculate a per-class FScore: • We then combine these scores into a weighted average:
FScore Caveats • The Zhao, Karypis paper focused on Hierarchical clustering, so the definitions of Precision/Mean and FScore might not apply as well to “flat” clustering. • The metrics rely on the use of class labels, so they can not be applied in situations were there is no labeled data.
Possible Modifications • Calculate a per-cluster (not per class FScore: • Combine these scores into a weighted average:
Rand Index • Yeung, et al., 2001 • Measure of partition agreement • Answers the question “How similar are these two ways of partitioning the data?” • To evaluate clusters, we compute the Rand Index between actual labels and clusters
Rand Index • a = # pairs of documents that are in the same Si and Lr • b = # pairs of documents that are in the same Lr, but not the same Si • c = # pairs of documents in the same Si, but not the same Lr • d = # pairs of documents that are not in the same Lr nor Si.
Adjusted Rand Index • The Rand index has a problem, the expected value for any 2 random partitions is relatively high, we’d like it to be close to 0. • Adjusted Rand index puts the expected value at 0, gives a more dynamic range and is probably a better metric. • See appendix B of Yeung, et al., 2001.
Rand Index Caveat • Penalizes good, but finer grained clusters: imagine a sports class that produces 2 clusters, one for ball sports and one for track sports. • To fix that issue, we could hard label each cluster and treat all clusters with the same label as the same (clustering the clusters).
Problems • The metrics so far depend on class labels. • They also give undeserved high scores as k approaches n, because almost all instances end up alone in a cluster.
Label Entropy • My idea? (I haven’t seen it anywhere else) • Calculate an entropy value per cluster: • Combine entropies (weighted average):
Log Likelihood of Data • Calculate the log likelihood of the Data according to the clusterers model. • If the clusterer doesn’t have an explicit model, treat clusters as classes and train a class conditional model of the data based on these class labelings. Use the new model to calculate log likelihood.