Download
1 / 15
150 likes | 213 Views
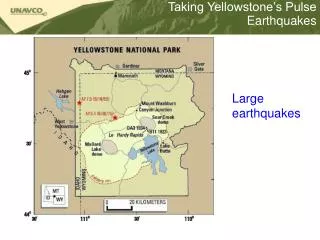
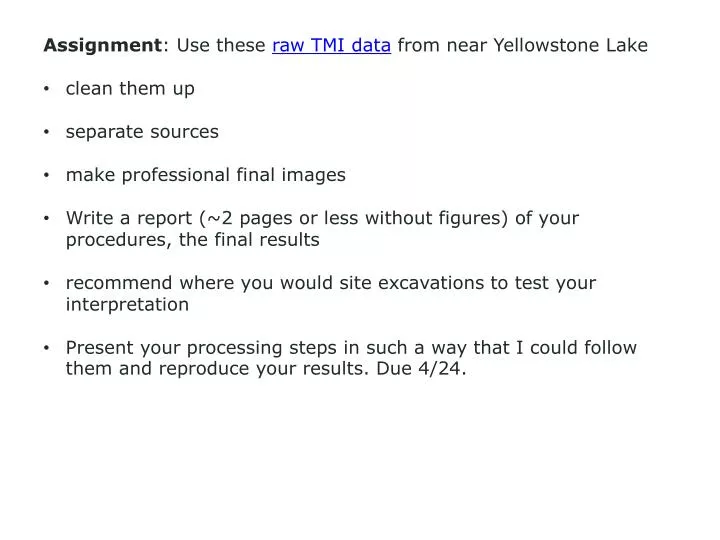
Assignment : Use these raw TMI data from near Yellowstone Lake clean them up separate sources make professional final images Write a report (~2 pages or less without figures) of your procedures, the final results recommend where you would site excavations to test your interpretation

E N D
Assignment: Use these raw TMI data from near Yellowstone Lake • clean them up • separate sources • make professional final images • Write a report (~2 pages or less without figures) of your procedures, the final results • recommend where you would site excavations to test your interpretation • Present your processing steps in such a way that I could follow them and reproduce your results. Due 4/24.
Step 1: Classed post map to see what the raw data look like High anomaly along a single line – probably an acquisition problem
Decorrugated with an 11x11 sized filter. This looks adequate; not much anomaly of probable interest is in the noise portion (right).
Watching this Upper row: successive upward continuations of 2, 4, 6, and 8 meters Lower row: successive differences of TMI/DC with the upward continuations above. Thus, these are equivalent layers of 0-1m, 0-2m, 0-3m, and 0-4m. The central high is consistent through deeper and deeper equivalent layers. Thus, this is probably geologic. There are some interesting, shorter wavelength anomalies superposed on the geologic signature. Upward of 6 meters seems okay.
Equivalent layer from 0 to 4 meters; losing some signal at arrow. Equivalent layer from 0 to 3 meters; not much different than that at the right.
Persistent all the way down Upper row is upward continuations of 8 and 10 meters; lower row is the resultant equivalent layers (0-4m and 0-5 m)
TMI_DC, upward continuation of 6 meters, and 0-3m equivalent layer
Upward continuation of 3 meters Upward continuation of 1 meter Range of nT is really not much different.
For detail, look at an 0.125 to 0.5 meter equivalent layer. Lower row is same image with total range on color scale (left) versus +/- two standard deviations on the right.
Compare 0-3 meter equivalent layer (left) with (0.125-0.5) on right. You can pick plenty of detail in both of these but the small anomalies are more apparent in the shallow slice.
0.125 – 0.5 meter layer Strong central source with associated radial distribution acquisition Plenty of small anomalies indicative of point sources Suspicious rectangular feature – historic garbage pit?
Another magnetics grid but one of the few where I have a picture of the source.