Download
1 / 6
60 likes | 136 Views
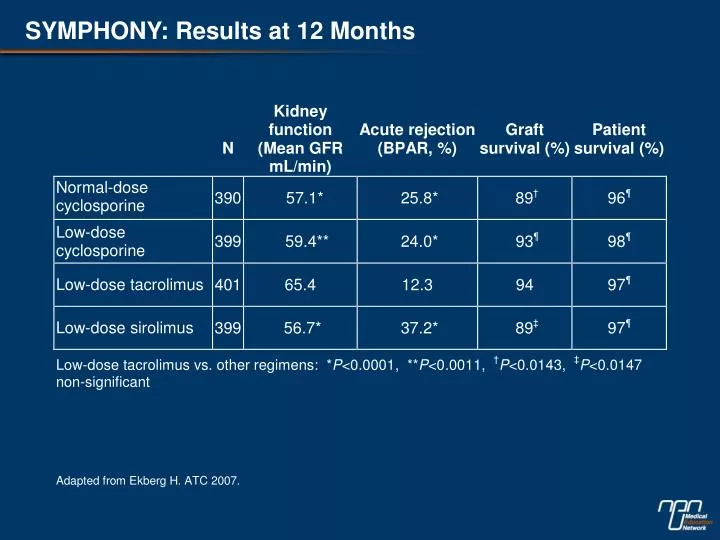
SYMPHONY: Results at 12 Months. SYMPHONY Study Design. 1 50-300 ng/ml for 3 months 100-200 ng/ml thereafter. A. Normal dose CsA. MMF. Steroids. 50–100 ng/ml. Daclizumab. Low dose CsA. B. MMF. Steroids. 3-7 ng/ml. Daclizumab. Low dose TAC. C. MMF. Steroids. 4-8 ng/ml.

E N D
SYMPHONY Study Design 150-300 ng/ml for 3 months 100-200 ng/ml thereafter A Normal dose CsA MMF Steroids 50–100 ng/ml Daclizumab Low dose CsA B MMF Steroids 3-7 ng/ml Daclizumab Low dose TAC C MMF Steroids 4-8 ng/ml Daclizumab Low dose SRL D MMF Steroids 6 mo 12 mo Tx Adapted from Ekberg H. ATC 2007.
p<0.0001 p=0.0011 p<0.0001 Renal Function-calculated GFR at month 12 (Cockcroft-Gault) Adapted from Ekberg H. ATC 2007.
Biopsy Proven Acute Rejection (ITT, Excluding Borderline) 0.5 37.2% Low-dose SRL 0.4 0.3 25.8% Normal-dose CsA Probability of acute rejection 24.0% Low-dose CsA 0.2 0.1 12.3% Low-dose TAC 0.0 0 2 4 6 8 10 12 Time (months) Adapted from Ekberg H. ATC 2007.
Graft and Patient Survival p = NS p=0.0143 p=0.0147 100 98% 100 97% 97% 96% 94% 93% 89% 89% 90 90 Patient survival (%) Graft survival (%) 80 80 70 70 12 months post-Tx 12 months post-Tx Normal-dose CsA Low-dose CsA Low-dose TAC Low-dose SRL Adapted from Ekberg H. ATC 2007.
Results at 12 months post-Tx P=0.0011 50 P<0.0001 100 P<0.0001 P<0.0001 90 37% P<0.0001 40 80 65 70 59 57 57 26% 30 60 24% BPAR (% of patients) 50 GFR (Cockcroft Gault) (ml/min) 20 40 12% 30 20 10 10 0 0 Calculated GFR(Cockcroft-Gault) Biopsy Proven Acute Rejection (ITT, Excluding Borderline) Normal-dose CsA Low-dose CsA Low-dose TAC Low-dose SRL Adapted from Ekberg H. ATC 2007.