Download

1 / 31
310 likes | 412 Views
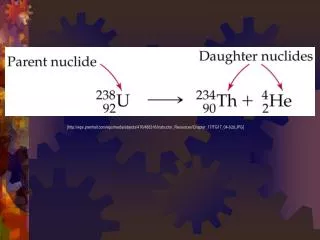
Problems with the uncertainty budget of half-life measurements. S. Pommé. Half-life Measurements. Half-life determination by following the decay of a radioactive source The problem of data discrepancy; examples Autocorrelation causes underestimation of the uncertainty

E N D
Problems with the uncertainty budget of half-life measurements S. Pommé
Half-life Measurements • Half-life determination by following the decay of a radioactive source • The problem of data discrepancy; examples • Autocorrelation causes underestimation of the uncertainty • Example: the decay of Fe-55 230th ACS NM - T1/2
Half-life of 109Cd a selection of the ‘best’ data 230th ACS NM - T1/2
Half-life of 134Cs 230th ACS NM - T1/2
Half-life of 54Mn a selection of the ‘best’ data 230th ACS NM - T1/2
Half-life of 55Fe 1020 1010 1000 Days 990 980 970 Morel Hoppes Schötzig Lagoutine Van Ammel Karmalitsyn Houtermans a selection of the ‘best’ data 230th ACS NM - T1/2
Why are uncertainties underestimated? It 's the MODELING, stu**d! ** by analogy with ‘It’s the economy, stupid!’ by James Carvil, advisor of Bill Clinton in the elections of 1992 230th ACS NM - T1/2
Example: decay of 55Fe measured activity fitted decay curve T1/2=1005.0 d ± 1.4d 230th ACS NM - T1/2
Procedure ‘uncertainty from fit’ • calculate the c2–value, ensuring that it assumes its expectation value = the number of degrees of freedom • adjust the half-life so that c2 increases by a value of one • adopt as the standard deviation the square root of the amount by which the half-life was varied Bevington, P.R. Data Reduction and Error Analysis for the Physical Sciences; McGraw-Hill Book Company, New York, USA, 1969 230th ACS NM - T1/2
Residuals 55Feadd uncertainty component of 0.0175% c2/n=3.5 c2/n=1.0 230th ACS NM - T1/2
Check of distribution of residuals BEFORE introducing extrauncertainty component AFTER c2/n=3.5 c2/n=1.0 230th ACS NM - T1/2
Half-life and uncertainty from least-squares fit => fit underestimates uncertainty! 230th ACS NM - T1/2
Why? least-squares fit requires RANDOMNESS 230th ACS NM - T1/2
Residuals 55Fe: blow up uncertainty only including counting statistics => does not fully account for spread of data 230th ACS NM - T1/2
Autocorrelated data are not random autocorrelation plot of the residuals 230th ACS NM - T1/2
Alternative Procedure • Subdivide instabilities according to frequency (low, medium, high) • Apply new (simplified) uncertainty formula: n= the number of occurances of the effect n=1 for medium and low frequencies • Add all components as square sum 230th ACS NM - T1/2
Subdivide instabilities according to frequency noise, counting statistics, …=> random effects geometrical reproducibility, ‘seasonal’ effects,short-lived impurity, … dead time, detector/source degradation,background subtraction, … 230th ACS NM - T1/2
T1/2 from combination of all data T1/2 230th ACS NM - T1/2
Realistic uncertainty 230th ACS NM - T1/2
Some examples from literature 230th ACS NM - T1/2
Residuals Ba-133 data scatter exceeds uncertainty => unidentified HIGH FREQUENCY component NIM A390 (1997) 267-273 230th ACS NM - T1/2
Residuals Cs-134 MEDIUM FREQUENCY instability => fit underestimates uncertainty NIM A390 (1997) 267-273 230th ACS NM - T1/2
Residuals Ce-144 sign of LOW FREQUENCY deviation => fit tends to hide it NIM A390 (1997) 267-273 230th ACS NM - T1/2
Residuals Y-88 only a few measurement data => LACK OF INFORMATION NIM A390 (1997) 267-273 230th ACS NM - T1/2
Residuals Cd-109 OVERESTIMATION of measurement uncertainty => overestimates uncertainty of half-life? NIM A390 (1997) 267-273 230th ACS NM - T1/2
Residuals 99Tcm systematic deviation for short times electrometer range switching ARI 60 (2004) 317-323 230th ACS NM - T1/2
Conclusions • perform many measurements with good statistical accuracy and carefully study the randomness of the residuals • identify and quantify medium and low frequency instabilities separately and apply a conservative propagation factor to T1/2 • report in sufficient detail, for traceability Half-life measurements are NOT EASY ! 230th ACS NM - T1/2
Half-life of 93mNb 230th ACS NM - T1/2
Half-life of 152Eu a selection of the ‘best’ data 230th ACS NM - T1/2
Residuals Co-57 decreasing accuracy with time => extension of experiment becomes ineffective NIM A390 (1997) 267-273 230th ACS NM - T1/2
Residuals Ba-133 and Eu-152 ‘independent’ measurements showing correlations => ‘medium term’ detector instability NIM A390 (1997) 267-273 230th ACS NM - T1/2