Download
1 / 39
810 likes | 1.4k Views
Deposition Techniques for Thin Films and Sensing. Bohr Rutherford. Nano-materials. Carnot. Thin Film. Catalysis, Polymers. Bulk Fabrication. STM. SEM. Time (year). -100. Now. 100. -200. Historical Perspective of Material Synthesis. CVD & PVD thin film growth techniques.

E N D
Bohr Rutherford Nano-materials Carnot Thin Film Catalysis, Polymers Bulk Fabrication STM SEM Time (year) -100 Now 100 -200 Historical Perspective of Material Synthesis
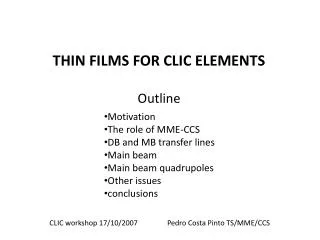
e- e- e- e- e- e- e- e- e- e- e- e- e- e- Ar+ Ar+ Ar+ Ar+ Ar Ar Ar+ Ar+ Cathode Cathode Cathode Cathode Cathode Cathode Cathode Cathode Anode Anode Anode Anode Anode Anode Anode Anode e- e- Ar+ Ar+ Ar+ Ar+ e- e- e- e- • Ar collides with the target surface • Metal atom and secondary electron release from the target • more secondary electrons are generated • Secondary electron ionizes Ar to Ar+ • Plasma will self-sustain • ionized Ar+s hit target surface DC Sputtering
Non-conductive target Conductive backing plate Ar+ - + + - Ar+ + + - - Ar+ Ar+ Ar+ e- e- e- Ar+ + - + - + - - + Ar+ e- e- e- Ar+ Ar+ Ar+ + - + - Ar+ - + - + e- e- e- Ar+ Ar+ - + + - Ar+ Ar+ Ar+ e- e- e- - + - + Ar+ Ar+ Ar+ Ar+ Ar+ ions hit the target surface. This bombardment will last for approximately 10-7 sec. Electrons hit target surface. This bombardment will last for approximately 10-9 sec. Self-bias RF Sputtering
Reactive Sputtering (I) • Easy compound fabrication cathodes Gas mixture (Ar + O2) Substrate • Oxide (oxygen) • Nitride (nitrogen) • Carbide (methane, acetylene, propane) • Sulfide (H2S) O2 Ar
Reactive Sputtering (II) Gas mixture (Ar + O2) O2 Ar Substrate
Sputtering Yield vs. Ion Energy Sputtering Ion implantation Bounce Back Energy < 5eV Intermediate energy Energy > 10KeV
Sputtering yield vs. chamber pressure Sputtering yield decreases as pressure increases.
Sputtering yield vs. Incidence angle cathodes Substrate Schematic diagram of main chamber and cathodes Schematic diagram showing the relationship between ion angle of incidence and sputtering yield In order to achieve high sputtering yield, cathodes are inclined
Phase Transformation Control • Phase of TiO2 : Anatase, Rutile, Brookite
Microstructure Control Transition structure consisting of packed fibrous grains Columnar grains Porous structure consisting of tapered crystallites separated by voids Recrystallized Grain structure Substrate temperature Working Pressure (Ar Pressure)
Main Chamber Mano Loadlock chamber Gate Valve Chamber CC Chamber TC High Vacuum Valve LL TC Turbo pump Back TC Turbo Backing Valve LL Rough Valve Rough Valve Mechanical pump Schematic diagram of the sputter system
Observed sensitivity trends with respect to thickness of TiO2 thin film sensors This thickness is comparable to the depletion length. Comparison of the sensitivity of sputtered films toward 250 ppm of CO at 550 C. Dutta et al., “Reactively sputtered titania films as high temperature carbon monoxide sensors,” Sensors and Actuators B, 106 (2005) 810-815
Observed sensitivity trends with respect to thickness of SnO2 thin film sensors Measured gas-sensitivity as a function of film thickness, for various H2 concentration: (a) 1000 ppm of H2; (b) 400 ppm of H21. 1Yong-sham Choe, “New gas sensing mechanism for SnO2 thin-film gas sensors fabricated by using dual ion beam sputtering,” Sensors and Actuators B, 77 (2001) 200-208
Theoretical calculation of the depth of electron depletion layer The Debye length as a function of carrier concentration can be represented as Ogawa1: McAleer2: The Debye length can be used to determine the possible maximum width of the depleted region. In this presentation, the width of the depleted region is the same as the Debye length. • H. Ogawa, M. Nishikawa, A. Abe, Hall measurement studies and an electrical conduction model of thin oxide ultrafine particle films, J. Appl. Phys. 53 (1982) 4448. • J.F. McAleer, P.T. Moseley, J.O.W. Norris, D.E. Williams, Tin dioxide gas sensors part 1. Aspects of the surface chemistry revealed by electrical variations, J. Chem. Soc.,Faraday Trans. 1 (83) 1323-1346.
Calculation of the Debye lenght The value of the dielectric constant of TiO2 ranges from 86 to 170 depending on the orientation of the optical axis 1. The dielectric constant of TiO2 is taken to be 128, an average value for a polycrystal. The charge carrier concentration ranges from 1015 / cm3 to 1018 / cm3. The Debye length is ~ 300 nm for a typical charge carrier concentration of 1017/ cm3 at 550 C. For SnO2, the Debye length is ~ 100 nm for the charge carrier concentration of 1018 / cm3. The Debye length of TiO2 using Ogawa equation 1U. Diebold, Surf.Sci.Rep. 48, 53(2003) 2Y. Choe, Sensors and Actuators B. 77, 200 (2001)
Sensitivity of the film as function of thickness (T<L) When films having the thickness (T) less than the depletion length is exposed to air, it is completely depleted. After exposing to gas such as H2 or CO, the depleted region shows a different resistance state because of electron donation. Sensitivity derivation for T < L Ra,d = a,d / T Rg,d = g, d / T S = Rg,d/Ra,d = g,d / a,d Where g,d , a,d are the resistivity of the air depleted region and the gas depleted region, respectively. For the model, the grain size in the film is assumed to increase with the thickness of the film1. 1 H. Chen, Y. Lu and W. Hwang, Thin Solid Films. 514, 316(2006)
The sensitivity changes as the thickness varies T < L The resistivity decreases as the thickness of the film increases due to increases in grain size. The sensitivity increases as the thickness of the film increases for T < L1. 1A. Ashour, Surf.Rev.Lett. 13, 87(2006)
Sensitivity of the film as function of thickness (T>L) When films having thickness (T) greater than the depletion length is exposed to air, it has two different resistance parts: (a) depleted part and the (b) bulk part. After exposing to gas such as H2 or CO, the depleted region shows a different resistance state because of electron donation. The bulk part will remain constant. where Rbulk is the resistance of the bulk part. bulk is the resistivity of the bulk part. Rair, Rgas are defined as the resistance of the film under air and gas, respectively. S is the sensitivity (Rgas / Rair).
The sensitivity changes as the thickness varies T > L The sensitivity decreases as the thickness of the film increases. As the resistivity of the bulk increases, the rate of the sensitivity decrease is reduced.
The sensitivity plot based on the model • The sensitivity decreases after crossing the Debye length. • Below the Debye length, the sensitivity increases as the thickness increases. • The proposed model explains the experimental trend.
Reactive sputtering method for TiO2 film deposition • Reactive sputtering is a process in which a fraction of at least one of the coating species enters the deposition system in the gas phase. • Advantage: • - compounds can be formed using relatively easy-to-fabricate metallic targets. • - insulating compounds can be deposited using DC power supplies.
Reactive sputtering schematic for TiO2 film deposition cathodes Ti metal target Gas mixture (Ar + O2) Substrate O2 Ar Reactive gas is added to Ar gas for reactive sputtering; He, N2, O2 can be used for reactive gas
TiO2 film at room temperature deposition Amorphous films are obtained.
XRD results for TiO2 films Amorphous TiO2 Anatase TiO2 Rutile TiO2 XRD data of TiO2 films after 2 hours, then annealed at 800 or 1000 C for 2 hours
XPS result of heat treated TiO2 films XPS results show that these films are TiO2 . The films were prepared for 2 hours deposition and annealed at 800 or 1000 C for 2 hours, respectively.
Cross-sectional image of a TiO2 thin film Au 0.5 m TiO2 Polished alumina 1 m Cross-sectional image of a TiO2 film after 8 hours, then annealed at 1000 C for 2 hours
Properties of TiO2 thin film after depositions The films seem to be continuous and dense from SEM observations. The film is amorphous as-deposited, but transforms to crystalline phases of depending on the annealing temperature. The film annealed at 1000 C for 2 hours is identified as the rutile phase. The anatase phase of the film is obtained when the film is annealed at 800 C for 2 hours. The deposition rate is approximately 1 nm / min.
Sensing behaviors of TiO2 thin film (300 nm thickness) after 1000 C annealing for 2 hours under various CO 1000 ppm 750 ppm 500 ppm 250 ppm
Sensing trend of TiO2 thin film after 1000 C annealing for 2 hours under 250 PPM CO with respect to the thickness of the films The thickness of the film is controlled by the deposition time. 90, 300, and 500 nm thickness of the films are used to observe the sensing properties. The sensitivity has a maximum value at the thickness comparable to the Debye length at two sensing operating temperatures.
Conclusions As-deposited film is amorphous. The film shows two different phases, anantase and rutile, depending on annealing temperature. Thin film sensors shows maximum sensitivity at a thickness comparable to the Debye length. The theoretical model predicts the experimental trend.