Download

1 / 32
360 likes | 557 Views
Random Field Theory. Methods for Dummies 2009 Lea Firmin and Anna Jafarpour. Image time-series. Statistical Parametric Map. Design matrix. Spatial filter. Realignment. Smoothing. General Linear Model. Statistical Inference. RFT. Normalisation. p <0.05. Anatomical reference.

E N D
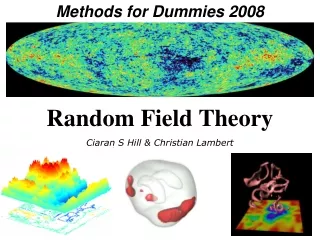
Random Field Theory Methods for Dummies 2009 Lea Firmin and Anna Jafarpour
Image time-series Statistical Parametric Map Design matrix Spatial filter Realignment Smoothing General Linear Model StatisticalInference RFT Normalisation p <0.05 Anatomicalreference Parameter estimates RFT for dummies - Part I
Overview • What‘s this all about? • Hypothesis testing • Multiple comparison • First approach: Bonferroni correction • Problem: non-independent samples… • Improved approach: random field theory • Implementation in SPM8 RFT for dummies - Part I
Single Voxel Level • A voxel (volumetric pixel) represents • a value (BOLD signal, density) • a location on a regular grid in 3D space • Brain: tens of thousands… RFT for dummies - Part I
Single Voxel Level • Does the value of a specific voxel significantly differ from its value assumed under H0? • Significant difference gives us localizing and discriminatory power RFT for dummies - Part I
Single Voxel Level: Statistics • H0 = (data randomly distributed, Gaussian distribution of noise, data variance pure noise) • Reject if: P(H0) < • = P(type I error) = P(t-value > t-value|H0) • set t-value (thresholding) RFT for dummies - Part I
Threshold • Value above which a result is unlikely to have arisen by chance • High threshold: good specificity (few false positives), but risk of false negatives • Low threshold: good sensitivity (few false negatives), but risk of false positives RFT for dummies - Part I
Many voxels, many statistic values! • „If we do not know, where in the brain an effect occurs, our hypothesis refers to the whole volume of statistics in the brain.“ • Single voxel level: = P(t > t| H0) usually 0.05 • Family of 1000 voxels: expect 50 false positives at threshold tv • H0 can only be rejected if the whole observed volume of voxels is unlikely to have arisen from a null distribution, i.e. if no t-value above threshold is found • Required: threshold that can control family-wise error RFT for dummies - Part I
Multiple Comparison • Occurs when one considers a family of statistical inferences simultaneously (across voxels) • Also if multiple hypothesis are tested at each voxel (across contrasts) • Hypothesis tests that incorrectly reject the H0 are more likely to occur, i.e. significant differences are more often accepted even if there are none (increase in type I error) RFT for dummies - Part I
Family-wise Error Rate = P(type I error at single voxel) 1 - = P(no type I error single voxel) for > 1 voxel: … P(A∩B) = P(A)×P(B) … (1 - )n = P(no type I error at any voxel within the family) 1 - (1- )n = P(type error at any voxel within the family) = PFWE where n = number of comparisons (voxels) PFWE > need for correction! RFT for dummies - Part I
Bonferroni Correction • For small , PFWE = 1 - (1- )n simplifies to PFWE ≤ n · (binomial expansion) • new for single voxel level in order to get requested PFWE : = PFWE / n RFT for dummies - Part I
Problem • Fewer independent values in the statistic volume than there are voxels due to spatial correlation • Bonferroni correction thus too conservative = PFWE / n remember: if small, H0 is more difficult to reject RFT for dummies - Part I
Spatial Correlation • Spatial preprocessing • Realignment of images for an individual subject to correct for motion • Normalize a subject‘s brain to a template to compare between subjects • Spatially extended nature of the hemodynamic response • Smoothing RFT for dummies - Part I
Smoothing • Averaging over one voxel and its neighbours ( reduction of independent observations) • Usually weighted average using a (Gaussian) smoothing kernel RFT for dummies - Part I
Smoothing kernel FWHM (Full Width at Half Maximum) RFT for dummies - Part I
How many independent observations? no simple way to calculate Bonferroni correction cannot be used RFT for dummies - Part I
Random Field Theory Part II Anna Jafarpour RFT for dummies - Part II 18/10/2009 16
Introduction • Random field theory (RFT) is a recent body of mathematics defining theoretical results for smooth statistical maps [1]. • Random field is a list of random numbers whose values are mapped onto a space (of n dimensions). Values in a random field are usually spatially correlated in one way or another, in its most basic form this might mean that adjacent values do not differ as much as values that are further apart [2]. [1] Brett M., Penny W. and Keibel S. (2003) Human Brain Mapping. Chapter 14: An introduction to Random Field Theory. [2] http://en.wikipedia.org/wiki/Random_field RFT for dummies - Part II 18/10/2009 17
Why we need RFT aim • NULL hypothesis says : • all activations were merely driven by chance • each voxel value has a random number Correction of FEW means to control the probability of it. • Random field has the characteristic of data under Null Hypothesis. RFT for dummies - Part II 18/10/2009 18
^ Estimated component fields voxels ? ? = + parameters errors scans data matrix design matrix parameterestimates • estimate residuals estimated variance = Each row is an estimated component field estimatedcomponentfields RFT for dummies - Part II
Random field and type 1 error Let’s assume that the estimatedcomponent fields is a random field: • Let’s assume that there is no signal in the tested data. Then the error should be a random field. Now we try to find a proper threshold for it, which let us reject the null hypothesis erroneously with probability of α. • Random field and our data has properties in common: We usually do not know the extent of spatial correlation in the underlying data before smoothing. • If we do not know the smoothness, we don’t worry! It can be calculated using the observed spatial correlation in the images. RFT for dummies - Part II 18/10/2009 20
Euler characteristic (EC) helps Threshold: z = 0 Threshold: z =1 • The Euler characteristic is a property of an image after it has been thresholded. • For our purposes, the EC can be thought of as the number of blobs in an image after thresholding. RFT for dummies - Part II 18/10/2009 21
the average or expected EC: E[EC] EC= 3 1 2 EC= 0 3 Threshold =3 (?) EC= 2 ... ... m EC= 4 E[EC]= The probability of getting a z-score > threshold by chance E [EC], corresponds (approximately) to the probability of finding an above threshold blob in our statistic image. RFT for dummies - Part II 18/10/2009 22
E[EC] = α • E[EC] is = The probability of getting a z-score > threshold by chance = probability of rejecting the null hypothesis erroneously (α) • We need thresholding the random field at E[EC] < 0.05 (α-level) for correction • Which Z-score has such E[EC] ? RFT calculates that! The result will be our threshold (the score) and any z-scores above that will be significant. RFT for dummies - Part II 18/10/2009 23
RFT calculates • E[EC] depends on: • z Chosen threshold z-score • R Volume of search region • R Spatial extent of correlation among values in the field; (it is described by FWHM) • What is R? • R is the “ReSels”. • “ReSel” is number of “resolution elements” in the statistical map. (SPM calculates it ) α=E[EC]= R (4 ln 2) (2π) -3/2z exp(-z2/2) RFT for dummies - Part II 18/10/2009 24
SPM8 and RFT RFT for dummies - Part II 18/10/2009 25
Summery of FWE correction by RFT • RFT stages on SPM: • First SPM estimates the smoothness (spatial correlation) of our statistical map. R is calculated and saved in RPV.img file. • Then it uses the smoothness values in the appropriate RFT equation, to give the expected EC at different thresholds. • This allows us to calculate the threshold at which we would expect 5% of equivalent statistical maps arising under the null hypothesis to contain at least one area above threshold. RFT for dummies - Part II 18/10/2009 26
SPM8 and RFT • We can use FWE correction in different ways on SPM8 [1] • Using FWE correction on SPM, calculates the threshold over the whole brain image. We can specify the area of interest by masking the rest of the brain when we do the second level statistic analysis. • Using uncorrected threshold, none, (usually p= 0.001). Then correcting for the area we specify. (Small Volume Correction (SVC)) [1] SPM manual, http://www.fil.ion.ucl.ac.uk/spm/doc/ RFT for dummies - Part II 18/10/2009 27
Example RFT for dummies - Part II 18/10/2009 28
RFT for dummies - Part II 18/10/2009 29
Acknowledgement • The topic expert: • Dr. Will Penny • The organisers: • Maria Joao Rosa • Antoinette Nicolle • Method for Dummies 2009 RFT for dummies - Part II
Thank you RFT for dummies - Part II 18/10/2009 31