Download
1 / 30
300 likes | 613 Views
OSPF Monitor Architecture, Design and Deployment Experience. Aman Shaikh Albert Greenberg AT&T Labs - Research NSDI 2004. Objectives for OSPF Monitor. Real-time analysis of OSPF behavior Trouble-shooting, alerting, validation of maintenance Real-time snapshots of OSPF network topology

E N D
OSPF MonitorArchitecture, Design and Deployment Experience Aman Shaikh Albert Greenberg AT&T Labs - Research NSDI 2004 OSPF Monitor - NSDI 2004
Objectives for OSPF Monitor • Real-time analysis of OSPF behavior • Trouble-shooting, alerting, validation of maintenance • Real-time snapshots of OSPF network topology • Off-line analysis • Post-mortem analysis of recurring problems • Generate statistics and reports about network performance • Identify anomaly signatures • Facilitate tuning of configurable parameters • Improve maintenance procedures • Analyze OSPF behavior in commercial networks OSPF Monitor - NSDI 2004
OSPF Monitor in a Nutshell • Collect OSPF LSAs (Link State Advertisements) passively from network • Every router describes its local connectivity in an LSA • Router originates an LSA due to... • Change in network topology • Periodic soft-state refresh • LSA is flooded to other routers in the domain • Flooding is reliable and hop-by-hop • Flooding leads to duplicate copies of LSAs being received • Every router stores LSAs (self-originated + received) in link-state database (= topology graph) • Real-time analysis of LSA streams • Archive LSAs for off-line analysis OSPF Monitor - NSDI 2004
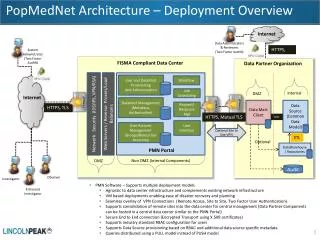
Components • Data collection: LSA Reflector (LSAR) • Passively collects OSPF LSAs from network • “Reflects” streams of LSAs to LSAG • Archives LSAs for analysis by OSPFScan • Real-time analysis: LSA aGgregator (LSAG) • Monitors network for topology changes, LSA storms, node flaps and anomalies • Off-line analysis: OSPFScan • Supports queries on LSA archives • Allows playback and modeling of topology changes • Allows emulation of OSPF routing OSPF Monitor - NSDI 2004
LSAG Real-time Monitoring OSPFScan Off-line Analysis LSA archive LSA archive LSA archive Example LSAs LSAs TCP Connection LSAs LSAR 1 LSAR 2 “Reflect” LSA “Reflect” LSA replicate LSAs LSAs LSAs OSPF Network Area 0 Area 2 Area 1 OSPF Monitor - NSDI 2004
How LSAR attaches to Network • Host mode • Join multicast group • Adv: completely passive • Disadv: not reliable, delayed initialization of LSDB • Full adjacency mode • Form full adjacency (= peering session) with a router • Adv: reliable, immediate initialization of LSDB • Disadv: LSAR’s instability can impact entire network • Partial adjacency mode • Keep adjacency in a state that allows LSAR to receive LSAs, but does not allow data forwarding over link • Adv: reliable, LSAR’s instability does not impact entire network, immediate initialization of LSDB • Disadv: can raise alarms on the router OSPF Monitor - NSDI 2004
LSAR R Please send me LSA L Please send me LSA L Please send me LSA L I have LSA L Partial Adjacency for LSAR I need LSA L from LSAR Partial state • Router R does not advertise a link to LSAR • LSAR does not originate any LSAs • Routers (except R) not aware of LSAR’s presence • Does not trigger routing calculations in network • LSAR’s going up/down does not impact network • LSARR link is not used for data forwarding OSPF Monitor - NSDI 2004
LSA aGregator (LSAG) • Analyzes “reflected” LSAs from LSARs in real-time • Generates console messages: • Change in OSPF network topology • ADJACENY COST CHANGE: rtr 10.0.0.1 (intf 10.0.0.2) rtr 10.0.0.5 old_cost 1000 new_cost 50000 area 0.0.0.0 • Node flaps • RTR FLAP: rtr 10.0.0.12 no_flaps 7 flap_window 570 sec • LSA storms • LSA STORM: lstype 3 lsid 10.1.0.0 advrt 10.0.0.3 area 0.0.0.0 no_lsas 7 storm_window 470 sec • Anomalous behavior • TYPE-3 ROUTE FROM NON-BORDER RTR: ntw 10.3.0.0/24 rtr 10.0.0.6 area 0.0.0.0 • Dumps snapshots of network topology OSPF Monitor - NSDI 2004
OSPFScan • Tools for off-line analysis of LSA archives • Parse, select (based on queries), and analyze • Functionality supported by OSPFScan • Classification of LSA traffic • Change LSAs, refresh LSAs, duplicate LSAs • Emulation of OSPF Routing • How OSPF routing tables evolved in response to network changes • How end-to-end path within OSPF domain looked like at any instance • Modeling of topology changes • Vertex addition/deletion and link addition/deletion/change_cost • Playback of topology change events • Statistics and report generation OSPF Monitor - NSDI 2004
Performance Evaluation • Performance of LSAR and LSAG through lab experiments • LSAR and LSAG are key to real-time monitoring • How performance scales with LSA-rate and network size OSPF Monitor - NSDI 2004
Measure LSA processing time for LSAG LSA LSA LSA Emulated topology LSA LSA Measure LSA pass-through time for LSAR Experimental Setup PC SUT LSAG TCP connection OSPF adjacency Zebra LSAR TCP connection OSPF Monitor - NSDI 2004
Methodology • Send a burst of LSAs from Zebra to LSAR • Vary number of LSAs (l) in a burst of 1 sec duration • Use of fully connected graph as the emulated topology • Vary number of nodes (n) in the topology • Performance measurements • LSAR performance: LSA “pass-through” time • Zebra measures time difference between sending and receiving an LSA from LSAR • LSAG performance: LSA processing time • Instrumentation of LSAG code OSPF Monitor - NSDI 2004
LSAR Performance OSPF Monitor - NSDI 2004
LSAG Performance OSPF Monitor - NSDI 2004
Deployment • Tier-1 ISP network • Area 0, 100+ routers; point-to-point links • Deployed since January, 2003 • LSA archive size: 8 MB/day • LSAR connection: partial adjacency mode • Enterprise network • 15 areas, 500+ routers; Ethernet-based LANs • Deployed since February, 2002 • LSA archive size: 10 MB/day • LSAR connection: host mode OSPF Monitor - NSDI 2004
LSAG in Day-to-day Operations • Generation of alarms by feeding messages into higher layer network management systems • Grouping of messages to reduce the number of alarms • Prioritization of messages • Validation of maintenance steps and monitoring the impact of these steps on network-wide OSPF behavior • Example: • Network operators use cost-out/cost-in of links to carry out maintenance • A “link-audit” web-page allows operators to keep track of link costs in real-time OSPF Monitor - NSDI 2004
Problems Caught by LSAG • Equipment problem • Detected internal problems in a crucial router in enterprise network • Problem manifested as episodes of OSPF adjacency flapping • Configuration problem • Identified assignment of same router-id to two routers in enterprise network • OSPF implementation bug • Caught a bug in type-3 LSA generation code of a router vendor in ISP network • Faster refresh of LSAs than standards-mandated rate OSPF Monitor - NSDI 2004
Long Term Analysis by OSPFScan • LSA traffic analysis • Identified excessive duplicate LSA traffic in some areas of Enterprise Network • Led to root-cause analysis and preventative steps • Statistics generation • Inter-arrival time of change LSAs in ISP network • Fine-tuning configurable timers related to route calculation (= SPF calculation) • Mean down-time and up-time for links and routers in ISP network • Assessment of reliability and availability OSPF Monitor - NSDI 2004
Lessons Learned through Deployment • New tools reveal new failure modes • Real-time alerting and off-line analysis are complementary • Distributed architecture helped a lot • OSPF exhibits significant activity in real networks • Maintenance and genuine problems • Add functionality incrementally and through interaction with users • Archive all LSAs • LSA volume is manageable • Don’t throw away refresh and duplicate LSAs OSPF Monitor - NSDI 2004
Conclusion • Three component architecture • LSAR: data collection • LSAG: real-time analysis • OSPFScan: off-line analysis • Performance analysis • LSAR and LSAG scale well as LSA-rate and network size increases • Deployment • Deployed in Tier-1 ISP and Enterprise network • Has proved to be an extremely valuable tool for network management • “OSPF Monitor was a Lifesaver” • VP of Networking, Enterprise network OSPF Monitor - NSDI 2004
Future Work • Real-time analysis • Correlation with other fault and performance data for more meaningful alerting • Prioritization of alerts • Off-line analysis • Correlation with other data sources • Work already underway: BGP, fault, performance • Identification of problem signatures and feeding them into real-time component for problem prediction OSPF Monitor - NSDI 2004
Backup Slides OSPF Monitor - NSDI 2004
Overview of OSPF • OSPF is a link-state protocol • Every router learns entire network topology • Topology is represented as graph • Routers are vertices, links are edges • Every link is assigned weight through configuration • Every router uses Dijkstra’s single source shortest path algorithm to build its forwarding table • Router builds Shortest Path Tree (SPT) with itself as root • Shortest Path Calculation (SPF) • Packets are forwarded along shortest paths defined by link weights OSPF Monitor - NSDI 2004
Border routers Area 1 Area 2 Area 0 Areas in OSPF • OSPF allows domain to be divided into areas for scalability • Areas are numbered 0, 1, 2 … • Hub-and-spoke with area 0 as hub • Every link is assigned to exactly one area • Routers with links in multiple areas are called border routers OSPF Monitor - NSDI 2004
OSPF domain R1’s View R1 R1 Area 0 Area 0 200 100 200 100 R2 R3 R2 R3 400 500 400 500 300 200 300 200 B1 B2 B1 B2 20 10 C1 C2 60 70 20 10 50 10.10.4.0/24 10.10.5.0/24 10.10.5.0/24 10.10.4.0/24 Area 1 Area 1 Summarization with Areas • Each router learns • Entire topology of its attached areas • Information about subnets in remote areas and their distance from the border routers • Distance = sum of link costs from border router to subnet OSPF Monitor - NSDI 2004
Link State Advertisements (LSAs) • Every router describes its local connectivity in Link State Advertisements (LSAs) • Router originates an LSA due to… • Change in network topology • Example: link goes down or comes up • Periodic soft-state refresh • Recommended value of interval is 30 minutes • LSA is flooded to other routers in the domain • Flooding is reliable and hop-by-hop • Includes change and refresh LSAs • Flooding leads to duplicate copies of LSAs being received • Every router stores LSAs (self-originated + received) in link-state database (= topology graph) OSPF Monitor - NSDI 2004
Adjacency • Neighbor routers (i.e., routers connected by a physical link) form an adjacency • The purpose is to make sure • Link is operational and routers can communicate with each other • Neighbor routers have consistent view of network topology • To avoid loops and black holes • Link gets used for data forwarding only after adjacency is established • Use of periodic Hellos to monitor the status of link and adjacency OSPF Monitor - NSDI 2004
Equipment Problem at Enterprise Network • Internal errors in a router in area 0 • Episodes where router would drop adjacencies with other routers • Problem manifested in LSAG as “ADJ UP” and “ADJ DOWN” messages • Not visible in other network management systems • Led to proactive maintenance OSPF Monitor - NSDI 2004
Area 0 Area 2 Genuine Anomaly Genuine Anomaly Days Days Artifact: 23 hr day (Apr 7) Days Days Area 3 Area 4 LSA Traffic in Enterprise Network Refresh LSAs Change LSAs Duplicate LSAs OSPF Monitor - NSDI 2004
Overhead: Duplicate LSAs • Why do some areas witness substantial duplicate LSA traffic, while other areas do not witness any? • OSPF flooding over LANs leads to control plane asymmetries and to imbalances in duplicate LSA traffic Days OSPF Monitor - NSDI 2004