Download
1 / 17
170 likes | 289 Views
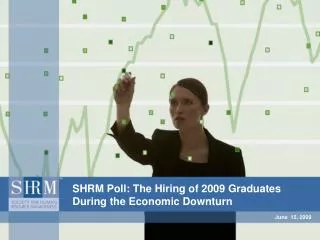
The Economic Downturn: The Employees’ Perspective. January 12, 2009. In your opinion, to what extent is your job at risk?. n=604. Note: Excludes respondents who answered “not sure” or did not answer the question. Percentages may not total 100% due to rounding.

E N D
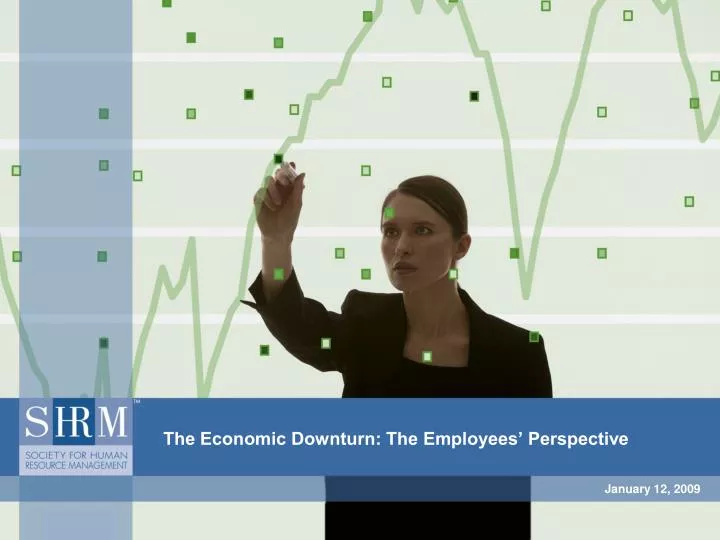
The Economic Downturn: The Employees’ Perspective January 12, 2009
In your opinion, to what extent is your job at risk? n=604 Note: Excludes respondents who answered “not sure” or did not answer the question. Percentages may not total 100% due to rounding.
In your opinion, right now, to what extent is your job at risk? (By Industry and Organization Sector) n=604 • Differences by industry: • Construction, mining, oil & gas reported a greater average perception of job risk than health care & social assistance. • Manufacturing reported a greater average perception of job risk than educational services/education, government/public administration, health care & social assistance or services – professional, scientific, technical, legal, engineering. • Differences by organization sector: • Publicly owned for-profit reported a greater average perception of job risk than privately owned for-profit, nonprofit, government • Privately owned for-profit reported a greater average perception of job risk than government • Based on a scale where 1 = “not at risk” and 4 = “significantly at risk.” Only significant differences are presented.
In your opinion, if the economy continues to decline over the next six months, to what extent is your job at risk? (By Industry and Organization Sector) n=604 • Differences by industry: • Construction, mining, oil & gas reported a greater average perception of future job risk than educational services/education, government/public administration or health care & social assistance. • High-tech reported a greater average perception of future job risk than government/public administration or health care & social assistance. • Manufacturing reported a greater average perception of future job risk than educational services/education, government/public administration, health care & social assistance, services – professional, scientific, technical, legal, engineering or other industries. • Retail/wholesale trade reported a greater average perception of future job risk than government/public administration or health care & social assistance. • Differences by organization sector: • Publicly owned for-profit and privately owned for-profit reported greater average perceptions of future job risk than nonprofit or government. • Based on a scale where 1 = “not at risk” and 4 = “significantly at risk.” Only significant differences are presented.
In your opinion, to what extent do you think the current downturn in the U.S. economy has made it difficult for you to find a job? n=21 Note: Includes only respondents who indicated that they were actively job searching. Excludes respondents who answered “not sure” or did not answer the question. Percentages may not total 100% due to rounding.
What is the likelihood that you will begin a job search (or increase the intensity of your ongoing job search) once the economy and job market improve? n=602 Note: Excludes respondents who answered “not sure” or did not answer the question. Percentages may not total 100% due to rounding.
What is the likelihood that you will begin a job search (or increase the intensity of your ongoing job search) once the economy and job market improve? (By Employee Level) n=604 • Differences by employee level: • Middle management and non-management reported greater average likelihood or beginning or intensifying a job search than executive level. • Based on a scale where 1 = “very unlikely” and 4 = “very likely.” Only significant differences are presented.
In the past six months, what actions have you taken in response to the downturn in the economy? n=317 Note: Excludes respondents who answered “Not applicable, I have not taken any actions in the past six months” or did not answer the question. Percentages do not total 100% as multiple response options were allowed. The response category “Controlled discretionary spending and/or reduced expenditures” was recoded from write-in responses in the “other” response category.
In the past six months, what actions have you taken in response to the downturn in the economy? (By Employee Level, Organization Staff Size and Organization Sector) n=604 • Differences by employee level: • Middle management were more likely than non-management to report having dropped their life insurance. • Differences by organization staff size: • large-staff-sized organizations were more likely than small-staff-sized organizations to report having reduced their contributions to their employer-sponsored retirement savings plan. • Differences by organization sector: • Publicly owned for-profit were more likely than nonprofit to report having reduced their contributions to their employer-sponsored retirement savings plan. • Other sectors were more likely than privately owned for-profit, nonprofit, or government to report taking other actions. • Only significant differences are presented.
If your employer reduced/eliminated the following benefits (or has already reduced/eliminated), how much of a negative impact would this have for you? Note: Data sorted in descending order by percentage who responded “a significant negative impact.” Excludes respondents who answered “not applicable” or did not answer the question. Percentages may not total 100% due to rounding.
If your employer reduced/eliminated the following benefits (or has already reduced/eliminated), how much of a negative impact would this have for you? (Average Ratings By Employee Level, Organization Staff Size, Industry and Organization Sector) • Differences by employee level: • Middle management and non-management reported greater average negative impact than executive level for eliminating healthcare benefits completely. • Middle management and non-management reported greater average negative impact than executive level for reducing retirement plan contributions. • Non-management reported greater average negative impact than executive level for suspending retirement plan contributions. • Differences by organization staff size: • Large-staff-sized organizations reported greater average negative impact than small-staff-sized organizations for reducing retirement plan contributions. • Large-staff-sized organizations reported greater average negative impact than small-staff-sized organizations for suspending retirement plan contributions. • Small-staff-sized organizations reported greater average negative impact than medium- or large-staff-sized organizations for reducing/eliminating flexible work arrangements. • Small-staff-sized organizations reported greater average negative impact than medium-staff-sized organizations for reducing/eliminating payment for professional development and/or membership in professional associations.
If your employer reduced/eliminated the following benefits (or has already reduced/eliminated), how much of a negative impact would this have for you? (Average Ratings By Employee Level, Organization Staff Size, Industry and Organization Sector - continued) • Differences by industry: • Educational services/education, high-tech and services – professional, scientific, technical, legal, engineering reported greater average negative impact than retail/wholesale trade for reducing healthcare benefits. • Educational services/education reported greater average negative impact than government/public administration, retail/wholesale trade or services – accommodation, food & drinking places for eliminating healthcare benefits completely. • Services – professional, scientific, technical, legal, engineering reported greater average negative impact than retail/wholesale trade or services – accommodation, food & drinking places for eliminating healthcare benefits completely. • Educational services/education reported greater average negative impact than retail/wholesale trade for reducing retirement plan contributions and suspending retirement plan contributions. • Differences by organization sector: • Government reported greater average negative impact than privately owned for-profit for reducing healthcare benefits, eliminating healthcare benefits completely, reducing retirement plan contributions and suspending retirement plan contributions. • Based on a scale where 1 = “no negative impact” and 4 = “a significant negative impact.” Only significant differences are presented.
In a difficult economy, how helpful has your organization’s HR department been in…? n=242 Note: Data sorted in descending order by percentage who responded “helpful.” Excludes respondents who answered “not applicable/don’t know” or did not answer the question. Percentages may not total 100% due to rounding.
To help employees cope with the current and possible future increases in gas prices, which of the following benefits would you like to see your organization offer or continue to offer? n=568 Note: Excludes respondents who did not answer the question. Percentages do not total 100% due to multiple response options.
To help employees cope with the current and possible future increases in gas prices, which of the following benefits would you like to see your organization offer or continue to offer? (By Employee Level, Organization Staff Size and Organization Sector) n=568 • Differences by employee level: • Middle management were more likely than executive level or non-management to report interest in seeing their organizations offer flexible work arrangement benefits. • Executive level were more likely than non-management to report interest in seeing their organizations raise the mileage reimbursement to the IRS cap. • Non-management were more likely than executive level to report interest in seeing their organizations reward employees with gas cards. • Executive level were more likely than middle management or non-management to report interest in seeing their organizations offer other benefits to offset the increase in gas prices. • Differences by organization staff size: • large-staff-sized organizations were more likely than small-staff-sized organizations to report interest in seeing their organizations allow more employees to take advantage of your organization’s flexible work arrangement benefits (e.g., telecommuting, flex time, compressed work week, etc.). • large-staff-sized organizations were more likely than small-staff-sized organizations to report interest in seeing their organizations offer IRS Section 132 transportation accounts (pretax transportation reimbursement accounts).
To help employees cope with the current and possible future increases in gas prices, which of the following benefits would you like to see your organization offer or continue to offer? (By Employee Level, Organization Staff Size and Organization Sector - continued) n=568 • Differences by organization sector: • Government agencies were more likely than publicly owned for-profit organizations to report interest in seeing their organizations offer employees cost of living raises as a direct result of gas prices. • Other sectors were more likely than publicly owned for-profit, privately owned for-profit, nonprofit or government sectors to report interest in seeing their organizations offer other benefits to offset the increase in gas prices. • Only significant differences are presented.
The Economic Downturn – The Employees’ Perspective Methodology • Sample comprised of 605 full-time or part-time employed United States residents randomly selected by an outside survey research organization’s web-enabled employee panel, which was based on a random sample of the entire U.S. telephone population. • Survey fielded for a two-week period ending January 12, 2009.