Download
1 / 17
170 likes | 432 Views
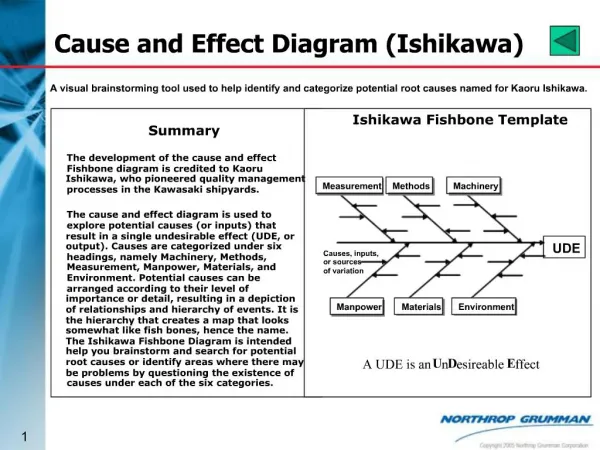
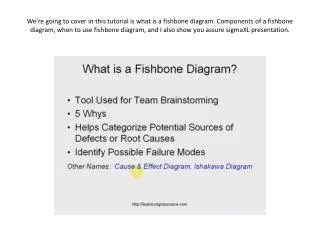
Ishikawa fishbone diagram. Skorkovský ESF MU KPH. Introduction (FBD= fishbone diagram). FDB is a tool to find out relationships : Use in QM especially in automotive industry On of the toot set used to create so called 8D report (8 disciplines=FBD+5WHYs+PA+QM)

E N D
Ishikawa fishbone diagram Skorkovský ESF MU KPH
Introduction (FBD= fishbone diagram) • FDB is a tool to find out relationships: • Use in QM especially in automotive industry • On of the toot set used to create so called 8D report (8 disciplines=FBD+5WHYs+PA+QM) • Another tool : 5 WHYs – will be cleared later Another tool : PARETO=PA analysis will be shown later Cause Effect
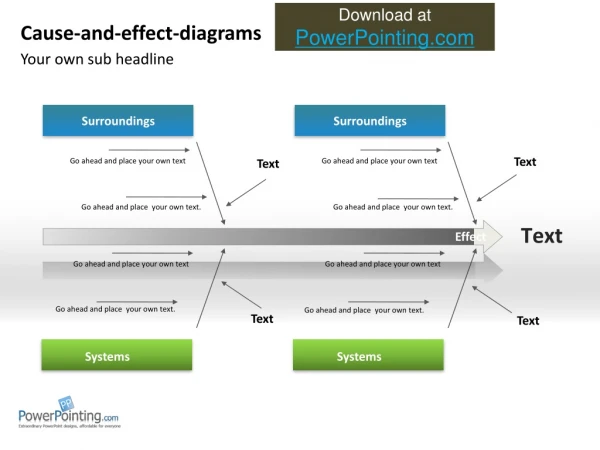
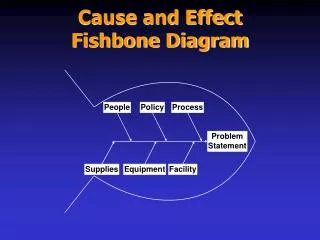
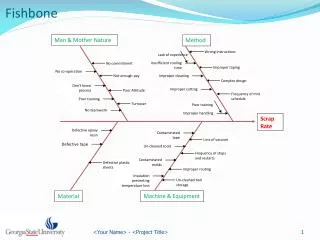
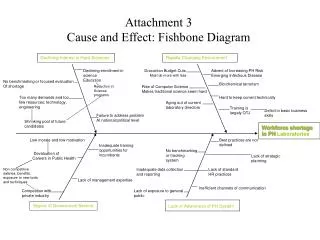
Fishbone diagram Mother Nature Men Salary To hot Training Terrible cold Dissatisfied worker Incapable Dangerous Treacherous Obsolete Management Machines (Methods, Material, Manpower, Measurement, Machines, Mother Nature,Management)
Some chosen problems which could be find out during ERP support process I • long response time to requirements • requirement is directed to unsuitable consultant • bad documentation about service action (poor log) • people ask repeatedly same questions at different moments and different consultants are asked • solution of disputes :complaint- standard service • payment asked for supplied services • how much (to whom, type of task, type of the error- see diagram • starting time for invoiced services, response time • requirement is handed over till the problem is solved • time of starting solving -solved • start of implementation of the bad object till end of testing • training
Some chosen problems which could be find out during ERP support process I • bad training methodology • bad consultants • bad communication protocol • telephone • e-mail • SKYPE • LYNC • lack of interest of the management of both parties • right specification of reaction time (reaction to errors) • specification to the error types and related response times • response time of the distributor (ERP integrator ERP)
Diagram – response time C1 did not solved find suitable resource (C1) D started work D solved the problem C1 handed over to customer C1 handed over to distributor (D) D ->C1 C1 solved C1 starts solving RESPONSE TIME RESPONSE TIME II handed over requirement = active work C1=consultant 1 = idle time
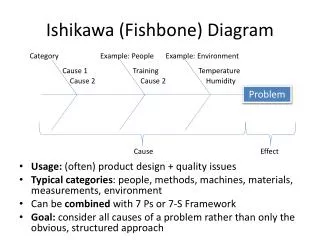
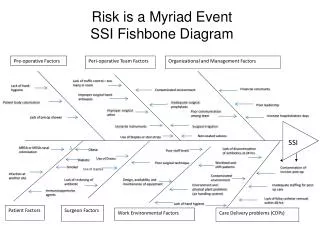
Fishbone diagram-support heart of the problem Mother Nature Men HR have a bad recruitment policy Low salary Bad training Bad weather Good weather Lower quality of the consultants Consultant takes holiday Phlegmatic person reacts later than expected Consultant is on sick leave Dissatisfied customer Incapable Bad communication Interest in golf only Bad SW for support (HELP DESK) Management Machines (Methods, Material, Manpower, Measurement, Machines)
5WHYs • WHY 1 :Why my car had stopped ? • No petrol in tank • WHY 2 :Why i did not have a petrol in my tank ? • I did not buy in the morning on my way to work WHY 3 :Why i did not buy a petrol ? • No money in my pockets • WHY 4 : Why no money i my pockets? • Evening poker • WHY 5 : Why i did not win a poker game? • I do not know how to bluff!
5WHYs Cause Effect
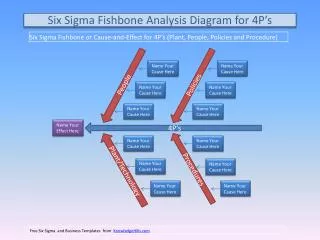
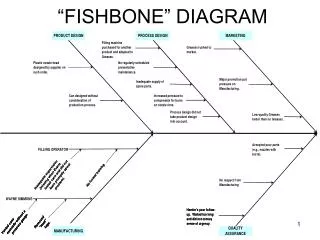
Difficulty Resignation Underestimation Low motivation 6 - (35,29 )- (35,29) 5 - ( 29,41 )- (64,71) 4 - ( 23,53 )- (88,24) 2 - ( 11,76 )- (100,00) Pareto analysis II - data Frequency Freq (%)Freq accum(%) Explanation : 35,29+29,41=64,71 64,71+23,53=88,24 88,24+11,76=100,00
Pareto analysis III Low motivation Underestimation Difficulty Resignation