Download
1 / 76
760 likes | 942 Views
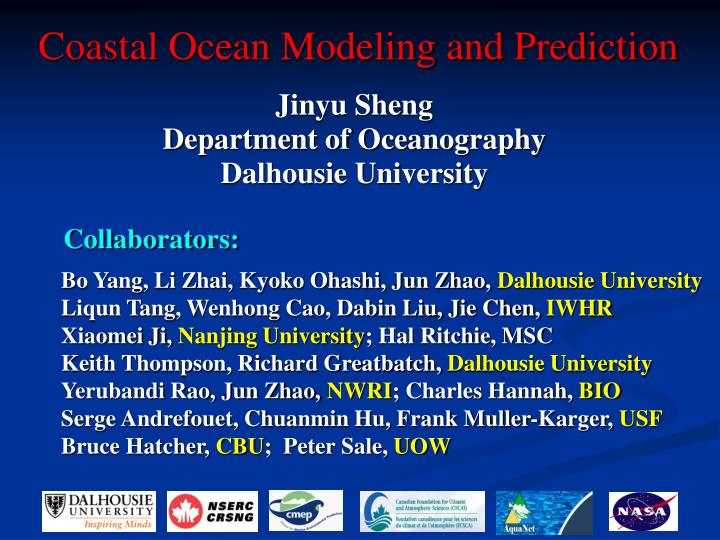
Coastal Ocean Modeling and Prediction. Jinyu Sheng Department of Oceanography Dalhousie University. Collaborators:. Bo Yang, Li Zhai, Kyoko Ohashi, Jun Zhao, Dalhousie University Liqun Tang, Wenhong Cao, Dabin Liu, Jie Chen, IWHR Xiaomei Ji, Nanjing University ; Hal Ritchie, MSC

E N D
Coastal Ocean Modeling and Prediction Jinyu Sheng Department of Oceanography Dalhousie University Collaborators: Bo Yang, Li Zhai, Kyoko Ohashi, Jun Zhao, Dalhousie University Liqun Tang, Wenhong Cao, Dabin Liu, Jie Chen, IWHR Xiaomei Ji, Nanjing University; Hal Ritchie, MSC Keith Thompson, Richard Greatbatch, Dalhousie University Yerubandi Rao, Jun Zhao, NWRI; Charles Hannah, BIO Serge Andrefouet, Chuanmin Hu, Frank Muller-Karger, USF Bruce Hatcher, CBU; Peter Sale, UOW
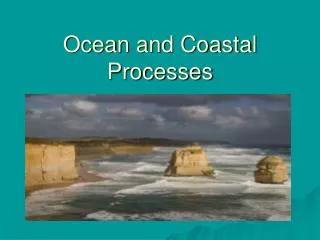
Contents Introduction: marine environmental observations and predictions over coastal waters Development of nested-grid coastal ocean circulation models using the semi-prognostic method Applications of nested-grid models in simulating tidal and storm-induced circulations over coastal waters Summary
1. Introduction • More than 60 percent of the world' s population lives within 60 kilometers of the coast and two-thirds of cities with population over 2.5 million are situated near estuaries. • Coastal zones are regions where the land meets the sea and are often under multiple and intense pressures such as: coastal development, water quality, shoreline erosion, public access, natural resource protection, coastal hazards such as hurricanes and flooding. • Reliable knowledge of physical conditions over coastal waters is needed for a more effective, ecosystem-based management of natural resources in the regions.
Storm Surge and Damage of Hurricane Katrina in New Orleans August 2005 (http:www.mthurricane.com)
Red-Tide (WHOI/NASA) Red tide algal bloom at Leigh, near Cape Rodney Papua New Guinea (巴布亚新几内亚) Photo by Miriam Godfrey, NIWA
新华社青岛2008年6月29日电 : 浒苔聚集影响奥运会运动员训练青岛市动员万人千舟清海藻 海藻暴发的成因: Jasondts:海藻(algal bloom)问题是否是恶势力对中国奥运的一次破坏行动? 黄海水产研究所:漂浮的海藻是从其南方的原生地漂浮而来的。南方暴发洪水,大量繁育的海藻被冲入南方海域,并随海流大量漂浮至青岛沿海。 某网友:海藻大面积爆发,就没有我们城市环保方面的问题吗?比如,各种有机化合物的排放超标问题,这个季节的海洋洋流就是从南方流向青岛吗?为什么大连现在还没有?
Indian Ocean Tsunami, December 2004 (NASA/JPL) (NOAA) Tsunamis up to 10 meters in height that caused immense damage and loss of life in coastal areas of the Indian Ocean. (A village near the coast of Sumatra Photo by PA McDaniel, US Navy)
Numerical Ocean Circulation Models • Numerical ocean circulation models are very useful to understand and predict(or forecast) 3D circulations and sea level variations over coastal waters. • Numerical models solve numerically the Reynolds-averaged Navier-Stokes differential equations using the finite-difference, finite-element, control-volume, or Galerkin-spectral methods.
Model grid could be structured or unstructured. • Unstructured grid has a great advantage of higher spatial resolution over focus regions and relatively coarser resolution over other regions. • Widely used coastal circulation models: POM, ROMS, QUADDY, SPEM, FVCOM, MITgcm, UnTRIM, …. (Adopted from Tom Gross and Rich Signell) Unstructured Mesh Uniform Rectilinear Grid Curvilinear Orthogonal Grid
Significant progress has been made recently in developing nested-grid models under either structured or unstructured grid. • A nested-grid model consists of one or more finer-resolution sub-models embedded inside a courser-resolution sub-model.
2. Development of nested-grid coastal ocean models using the semi-prognostic method • There are two types of techniques are used for nesting: one-way nesting and two-way nesting. • One-way nesting (dynamically downscaling) is simple and relatively easy to implement, but it only allows the outer model to affect the inner models. • Two-way nesting allows two-way interactions between the outer and inner models, and is much harder to implement.
Conventional nesting techniques: • Exchange information through the dynamic interfaces (Kurihara et al., 1979). • Replace the outer model variables with the inner model variables over the common subregion (Oey and Chen, 1992). • The new two-way nesting technique: • Exchange information between nested grids using the semi-prognostic method(Sheng et al., 2001; Eden et al., 2003; Sheng and Tang, 2003; Greatbatch et al., 2003).
Diagnostic, Prognostic and Semi-Prognostic Methods 1. Pure-Diagnostic Method: Calculates ocean currents from given temperature and salinity fields. Relatively easy to run and robust in multi-year simulations. Incapable of simulating the interaction of temperature/salinity with the flow field (e.g. fronts, eddies, etc). 2. Pure-Prognostic Method: Calculates ocean currents, together with temperature and salinity fields. Capable of simulating baroclinic instability and convective mixing. Model performance deteriorates in longer simulations. 3. Semi-Prognostic Method (Sheng, Greatbatch, and Wright, 2001): Replace the conventional hydrostatic equation by: Model performance better in the multi-year simulations of currents, and temperature/salinity fields.
Two-Way Nesting Technique using the semi-prognostic method For the inner model: For the outer model: and are set to 0.5 Lateral boundary conditions for the inner model: • Sommerfield radiation condition (U,V,T,S) • Restoring to outer model values
3. Applications of Nested-Grid Models A: A Coastal Ocean prediction system for Canadian Atlantic coastal waters (NCOPS-LB) B: Connectivity study over the Caribbean Sea C: Storm-surge predictions over the Pearl River Estuary
CANDIE • CANDIE stands for CANadianversion of Diecast. • It is a 3D, primitive-equation, z-level ocean circulation model developed by Sheng et al. (1998). • It uses the fourth-order numerics and flux limiter. • CANDIEhas been applied to various shelf circulation modeling problems (e.g., Sheng et al., Jtech, 1998; Lu et al. CFAS, 2001; Sheng, JPO, 2001; Sheng et al., JGR, 2001; Sheng and Tang, JPO, 2003 and OD, 2004; Sheng and Wang, JGR, 2004;Wang et al., JPO, 2007; Sheng et al., PiO, 2006; Sheng and Rao, CSR, 2006; Tang et. al., JGR, 2006, Sheng et al., JGR, 2007; Yang et al., OD, 2007; Wang et al., JGR, 2007; Sheng et al., JGR, 2007; Zhai et al., JGR, 2008; Zhai et al., CRS, 2008 ). • Website: www.phys.ocean.dal.ca/programs/CANDIE
A: Storm-induced circulation in Caribbean Sea during Hurricane Mitch • Hurricane Mitch was one of most disastrous storms hitting the Central American countries, and generated significant coastal flooding and landslides and caused more than 9000 death. • Mitch started from a tropic depression to a tropical storm in the southern Caribbean Sea on Oct. 22, 1998 and strengthened to a Category-5 storm by Oct. 26 with maximum sustained wind speeds of ~285 km/h. • Mitch swept the Honduras and Nicaragua coasts and made landfall on Oct. 29, 1998. • Mitch generated about a meter of precipitation over Honduras, Nicaragua and Guatemala on its passage, causing massive flood and land slides.
Hurricane Mitch Cloud Image (NOAA) Damage in Tegucigalpa (USGS) Mudslide in San Juancito (USGS) Flooding in Mnagua (USGS)
Chlorophyll-a concentrations estimated from SeaWiFS remote sensing data (SeaWiFS : Sea viewing Wide Field-of-view Sensor) Andrefouet et al., 2002)
Circulation and river plumes during Hurricane Mitch (Sheng et al., JGR, 2007) Outer Model (19 km) Inner Model (2 km) Middle Model (6 km)
Model Setup and Forcing • The nested-grid model is integrated for 294 days from January 1 to October 21, 1998 forced by • 6 hourly NCEP/NCAR forcing (Kalnay et al., 1996) • Monthly mean surface heat flux (da Silva et al., 1994) • Monthly mean sea surface temperature and salinity • Time-mean freshwater discharges from 11 major rivers • Monthly mean currents through outer model open boundaries • The model is integrated for another 20 days from October 22 to November 10 with the following additional forcing: • A simple vortex associated with a moving storm (Fogarty, 2006) • Storm-induced precipitation (Huffman et al., 2001) • Storm-induced river runoff (Thattai et al., 2003; Burke and Sugg, 2006; Mastin and Olsen, 2002; Smith et al., 2002; UNCEP/GEF, 2002)
Mitch-induced precipitations estimated from multi-satellite data (Huffman et al. 1991)
Buoyancy Forcing associated with River Runoff Totally 11 rivers are considered, with salinity at each river head specified as: (salt balance) 1. Belize 7. Coco 2. Motagua 8. GdM 3. Ulua 9. San Juan 4. Cangrejal-Bonito 10. Sinu 5. Aguan 11. Magdalena 6. Patuca
Simulated near-surface currents and temperature during Hurricane Mitch
Main Features of Mitch-induced Circulations in the western Caribbean Sea • Strong divergent circulation under the storm and intense near-inertial circulation behind the storm. • Intense surface cooling behind the storm. • The SST cooling and near-inertial oscillations are biased to the right side of the storm track. • Consistent with previous studies (Chang and Anthes, 1978; Greatbatch, 1983; Zhai et al., 2005; Sheng et al., 2006).
Difference of Sea Surface Temperature (SST=Tstorm+clim-Tclim )Day 295 – 304 (October 23-November 1, 1998)
Spring Season Fall Season
B. Coastal Ocean Circulation Prediction System Part One:Development and application of a nested-grid modeling system • CMEP-Bay: Canadian coastal ocean observatory) • The 5-level nested-grid coastal circulation prediction system (NCOPS) • Storm-induced circulation during tropical storm Alberto Part Two: Baroclinic circulation in Lunenburg Bay in summer and fall 2003 (Li Zhai’s PhD thesis work) • Process study of baroclinic dynamics • Simulating 3D circulation in summer and fall 2003 • Data assimilation using the pressure-correction method
Canadian Coastal Observatory • The coastal ocean observatory (CMEP-Bay) was established in summer of 2002. • It provides continuous real-time observations of marine environmental variables in spring to fall of last 6 years. • The observatory was operational when Hurricane Juan made land fall within 50 km of the site in September, 2003 and tropical storm Alberto in June 2006.
Lunenburg Bay is a shallow coastal embayment • 8 km by 4 km with water depth less than 30 m Center of Marine Environmental Prediction (CMEP) • Canadian scientists established a coastal ocean observatory in Lunenburg Bay, Nova Scotia, as part of a research project of marine environmental observation and prediction in the Atlantic Ocean of Canada. • Funding agencies provided ~$3.6 millions for research infrastructure and ~$7 millions for research funding for 7 years. • The observing system measures physical, biological, chemical and atmospheric variables.
Ocean Observing System in Lunenburg Bay, Nova Scotia as part of CMEP-Bay Old Town Lunenburg---UNESCO World Heritage Site
Atmospheric Model Pressure, Winds Circulation Model CMEP-Bay: Forecast System Using Measurements from Land and Sea Remote Sensing & Ocean Observatories Sea Level, Currents Temp, Salinity Biology & Sediment Models
Nested-Grid Coastal Ocean Circulation Prediction System (NCOPS-LB) Main Features: • Five sub-models with different horizontal resolutions • Based on Dalcoast3 (POM) and CANDIE. • One-way nesting • Driven by astronomical forcing (WebTide) and meteorological forcing (forecast products produced by Meteorological Service of Canada, MSC)
NCOPS-LB (L1) Dalcoast3_2D POM1 (L2) Dalcoast3_3D WebTide Inner Scotia Shelf (L3) (L4) Three-bay model CANDIE2 Lunenburg Bay model (L5) 1Thompson et al., CRS, 2007; Ohashi et al., JGR, 2008 2Wang et al., JPO, 2007; Zhai et al., CRS, 2007; Zhai et al., JGR, 2008
(L2) (L3) Dalcoast3D ~7 km CANDIE ~1.1 km (L4) (L5) (L1) CANDIE ~500 m CANDIE ~180 m Dalcoast3D ~9 km Developed by Keith Thompson and his colleagues
Operational cycles of NCOPS-LB time Hindcast (24 H) Forecast (24 H) Forecast (24 H) today Hindcast (24 H) Forecast (24 H) Forecast (24 H) tomorrow Hindcast (24 H) Forecast (24 H) Forecast (24 H) day after tomorrow
Storm-Induced Circulation during Alberto Tropical Storm Alberto in June 2006: • The first tropical storm of the 2006 Atlantic hurricane season. • Formed on June 10 in the northwestern Caribbean Sea, and moved northward and then northeastward with a peak intensity of 110 km/h. • Moved through eastern Georgia, North Caroline and Virginia as a tropical depression before becoming an extra-tropical storm on June 14. • The remnants of Alberto produced strong winds and left four people missing in Atlantic Canada.
Model performance of NCOPS-LB Comparison of observed and simulated surface elevations
SB2 SB3 Comparison of observed and simulated currents at SB2 and SB3
Model SST and near-surface currents (18:00 July 1 2006) MODIS SST Data (by courtesy of Chris Jones)
Model Sensitivity Study Control Run Exp-RGW Exp-LWF
Numerical Simulation in August-October, 2003(based on Li Zhai’s Ph.D thesis work) Juan Wind Stress Tides and RGWs Surface Heat Flux Surface Freshwater Flux (Diagnosed)