Download
1 / 44
440 likes | 667 Views
MID301. Windows Server AppFabric Cache: A Methodology for Capacity Planning and Analyzing Performance Data. Jason Roth Principal Programming Writer Microsoft. Session Objectives and Takeaways. Session Objectives: Not a technology deep dive session

E N D
MID301 Windows Server AppFabric Cache: A Methodology for Capacity Planning and Analyzing Performance Data Jason Roth Principal Programming Writer Microsoft
Session Objectives and Takeaways • Session Objectives: • Not a technology deep dive session • Systematic methodology for capacity planning and monitoring • AppFabric Caching performance data & capacity indicators • Takeaways: • Some real life customer deployment scenarios • AppFabric Cache performance & scalability data • Grid Dynamics white paper • Capacity planning guidance to support customer deployments • Capacity planning methodology white paper
Customer discussion PlaybookA pattern seen from several customer engagements • What is AppFabric Cache & Why should I care? • Are others using this in real-world applications? • For our scenario(s), how much memory and how many servers do we need? • Can we see detailed performance and scalability data? • What are the capacity indicators & performance to monitor?
Customer discussion PlaybookA pattern seen from several customer engagements • What is AppFabric Cache & Why should I care? • Are others using this in real-world applications? • How much memory do we need? How many servers? • Can we see detailed performance and scalability data? • What are the capacity indicators & performance to monitor?
Problem Scenario • Need for activity/reference data store • Database must scale with more users • Local caching (ex: session state): • Sticky routing • Limited to server memory • Database used for caching: • Same scenario: database must scale • How can you have a design that is more dynamic and flexible for future growth? App Server 1 App Server 2 App Server 3 Local Store Local Store Local Store Database
Windows ServerAppFabric Caching Database Web App 1 Web App 2 Web Service 1 Local Cache Local Cache Local Cache
Windows AzureAppFabric Caching • Auto managed by Microsoft • Similar programming model as on-premise server • Some capacity planning processes apply while others are unecessary • Available as of the April 2011 Windows Azure AppFabric release.
Customer discussion PlaybookA pattern seen from several customer engagements • What is AppFabric Cache & Why should I care? • Are others using this in real-world applications? • How much memory do we need? How many servers? • Can we see detailed performance and scalability data? • What are the capacity indicators & performance to monitor?
AppFabric Caching Customer Examples • Based on Microsoft Customer Advisory Team (CAT) work • Multiple customers have adopted caching • Capacity planning guidelines based on these interactions
Customer discussion PlaybookA pattern seen from several customer engagements • What is AppFabric Cache & Why should I care? • Are others using this in real-world applications? • How much memory do we need? How many servers? • Can we see detailed performance and scalability data? • What are the capacity indicators & performance to monitor?
Case Study: Trey Research • Online portal that provides general health forums, doctor & hospital reviews and shopping cart for buying medicines from partner pharmacies • Software Systems overview • 4 Web Servers hosting the ASP.NET web application • Session state stored in SQL • 2 Application servers hosting WCF services • Clustered SQL Server with 32 GB RAM • Challenges • Performance & Availability concerns • Scalability needs – 2M new users expected in the next 6 months
Case Study • Which part of the system is having performance issues? • Is it high response times for medical forums page or reading doctor & hospital reviews? • Is the database or the webservers the scaling bottleneck? • With how many concurrent users does the problems show up? • Workload mix & load? • How many users are issuing writes Vs reads – updating forums, adding items to shopping cart, writing reviews Vs simply reading • Total Trey Research database size, Transitory writes generated
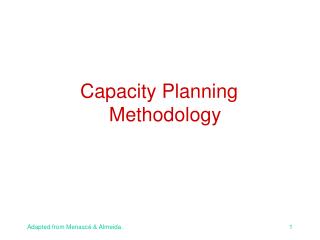
Capacity Planning Methodology • Understand bottlenecks & identify caching candidates • Evaluate current workload patterns • Understand physical infrastructure and hardware resources • Finalize the required performance SLA for all applications • Identify appropriate features & configuration settings • Estimate #servers with memory & network bandwidth
Analyze Application Performance (2 of 2)Evaluate Bottlenecks and Identify Caching Opportunities • Analysis Results: • “Hot” stored procedures • Slow-performing pages/service calls • Identify the candidates for caching • Reference: read-only shared across users • Activity: read/write per user • Resource: read/write shared across users
Evaluate Workload Requirements (1 of 3)Understand Current Patterns & Future Needs • Understand performance profile • Read/write profile? (90%/10%, etc.) • Read/write frequency? • Number of concurrent users • Any batched / bulk operations? • Understand future needs: • Number of projected users for the next 6-12 months
Evaluate Workload Requirements (2 of 3) • Understand maximum active objects to be cached
Evaluate Workload Requirements (3 of 3)Estimate the Required Memory for Cache Candidates • Estimate average object size (Post-Serialization) • Caching overheads: Objects, Regions, High Availability
Physical Infrastructure (1 of 2)Understand the Type and Availability of Hardware Resources • Physical or virtual machines? • If existing, server configuration(s)? • #CPUs, speed, memory, network card, etc. • Deployment topology • Servers’ location relative to application servers
Physical Infrastructure (2 of 2)Evaluate Networking Requirements and Capabilities • Network backbone & bandwidth: • Network card bandwidth per cache host • Network bandwidth across path • Example:
Performance SLA & ManageabilityBusiness Requirements • Different applications (cache clients) share cache cluster(s) • Heavy workload spikes of 1 application affecting the rest • High memory usage of 1 application affecting the rest • Key metric goals: • Acceptable Latency vs. Highest Throughput? • Operational Needs • Mission critical applications with minimal or no downtime • Security is maintained the cluster level
Configuration Settings (1 of 3)Factoring in AppFabric Features & Settings
Configuration Settings (2 of 3)Configuring and Understanding Cache Host Memory • Understand available caching memory per machine Non-expired objects evicted High Watermark (90%) Cached Data Expired objects evicted Cached Data Low Watermark (70%) Cache Host Memory Size (Example: 8 GB on a 16 GB machine) Caching Memory Target (Example: .70 * 8 = 5.6 GB) Cached Data Server (Cache Host)
Configuration Settings (2 of 2) • Example: • HA setting minimum number of hosts satisfied (>=3) • Buffer for both forced eviction & garbage collection
Case Study: Trey Research Recommendations • 1 Cache Cluster • 4 Servers • 16 GB • 22.4 GB of caching space for 21.4 GB requirement • 1 Gbps network • Shopping cart cache: non-evictable, high availability, session state • Other caches: evictable, direct cache access Web Server 1 Web Server 2 Web Server 3 Web Server 4 Shopping Cart Cache Medical Documents Cache Other Caches
Customer discussion PlaybookA pattern seen from several customer engagements • What is AppFabric Cache & Why should I care? • Are others using this in real-world applications? • How much memory do we need? How many servers? • Can we see detailed performance and scalability data? • What are the capacity indicators & performance to monitor?
Grid Dynamics Study • Windows Server AppFabric Cache: A detailed performance & scalability datasheet
Grid Dynamics: Testing Methodology • Vary one or two parameters per test. These include: • Most tests directly against cache • Two tests with WCF and ASP.NET “layers”
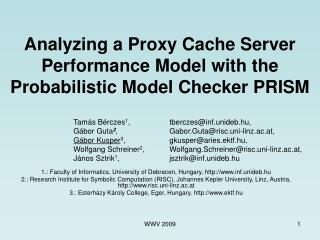
Grid Dynamics: Scalability Latency (ms) Dependency of throughput from cluster size for direct cache access (16KB byte array objects, 90% reads & 10% writes, default security)
Grid Dynamics: Conclusions • Cache size has low impact, except for large caches with high percentage of writes • High type complexity only affects client-side performance due to serialization • BulkGet result in better resource utilization • Direct cache access is much faster than proxies (ASP.NET, WCF) • Pessimistic and optimistic locking perform similarly • Cache cluster security does decrease performance, but may be required and is enabled by default • Network bottlenecks are reduced by using dedicated network between application servers and cache servers
Customer discussion PlaybookA pattern seen from several customer engagements • What is AppFabric Cache & Why should I care? • Are others using this in real-world applications? • How much memory do we need? How many servers? • Can we see detailed performance and scalability data? • What are the capacity indicators & performance to monitor?
Ongoing Performance Monitoring • Performance counters (More Complete List in Guides): • Windows PowerShell Commands (ex: Get-CacheClusterHealth) • Capacity Planning Guide: • http://go.microsoft.com/fwlink/?LinkID=216759 • Caching Deployment & Management Guide: • http://go.microsoft.com/fwlink/?LinkId=210215
Required Slide Speakers, please list the Breakout Sessions, Interactive Discussions, Labs, Demo Stations and Certification Exam that relate to your session. Also indicate when they can find you staffing in the TLC. Related Content • MID302 AppFabric Caching: How it Works and When You Should Use It • MID201 An Overview of the Microsoft Middleware Strategy • MID376-HOL Windows Server AppFabric Cache: Setup and First Steps • MID375-HOL Windows Server AppFabric Cache: Developer Basics • AppFabric Product Booth
Required Slide Track PMs will supply the content for this slide, which will be inserted during the final scrub. Track Resources • Windows Azure Platform Training Kit • Windows Server AppFabric Training Kit • BizTalk 2010 Developer Training Kit • AppFabric Team Blog • Windows Azure AppFabric on MSDN • Windows Server AppFabric on MSDN
Resources • Connect. Share. Discuss. http://northamerica.msteched.com Learning • Sessions On-Demand & Community • Microsoft Certification & Training Resources www.microsoft.com/teched www.microsoft.com/learning • Resources for IT Professionals • Resources for Developers http://microsoft.com/technet http://microsoft.com/msdn
© 2011 Microsoft Corporation. All rights reserved. Microsoft, Windows, Windows Vista and other product names are or may be registered trademarks and/or trademarks in the U.S. and/or other countries. The information herein is for informational purposes only and represents the current view of Microsoft Corporation as of the date of this presentation. Because Microsoft must respond to changing market conditions, it should not be interpreted to be a commitment on the part of Microsoft, and Microsoft cannot guarantee the accuracy of any information provided after the date of this presentation. MICROSOFT MAKES NO WARRANTIES, EXPRESS, IMPLIED OR STATUTORY, AS TO THE INFORMATION IN THIS PRESENTATION.