Download
1 / 36
360 likes | 573 Views
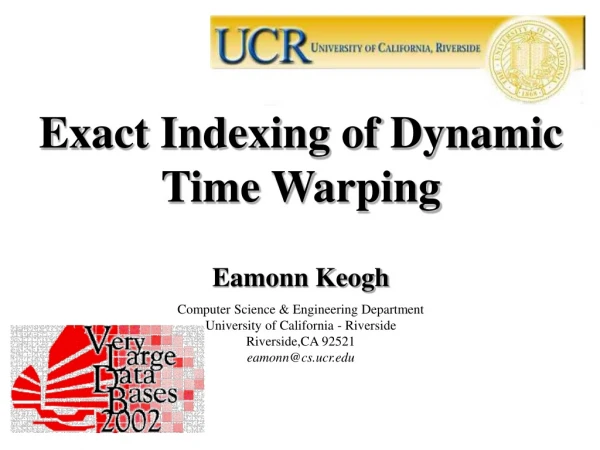
Exact Indexing of Dynamic Time Warping Eamonn Keogh Computer Science & Engineering Department University of California - Riverside Riverside,CA 92521 eamonn@cs.ucr.edu. Fair Use Agreement.

E N D
Exact Indexing of Dynamic Time Warping Eamonn Keogh Computer Science & Engineering DepartmentUniversity of California - RiversideRiverside,CA 92521eamonn@cs.ucr.edu
Fair Use Agreement If you use these slides (or any part thereof) for any lecture or class, please send me an email, if possible with a pointer to the relevant web page or document. eamonn eamonn@cs.ucr.edu
Outline of Talk • Why do Time Series Similarity Matching? • Limitations of Euclidean Distance • Dynamic Time Warping • Lower Bounding Dynamic Time Warping • Indexing Dynamic Time Warping • Experimental Evaluation • Conclusions • Questions
Why do Time Series Similarity Matching? Clustering Classification Rule Discovery Query by Content 10 s = 0.5 c = 0.3
Euclidean Vs Dynamic Time Warping Euclidean Distance Sequences are aligned “one to one”. “Warped” Time Axis Nonlinear alignments are possible.
Limitations of Euclidean Distance IClassification Classification Experiment on Cylinder-Bell-Funnel Dataset • Training data consists of 10 exemplars from each class. • (One) Nearest Neighbor Algorithm • “Leaving-one-out” evaluation, averaged over 100 runs • Euclidean Distance Error rate 26.10% • Dynamic Time Warping Error rate2.87%
Limitations of Euclidean Distance IIClustering Sunday Friday Saturday Thursday Monday Tuesday Wednesday Wednesday was a national holiday Euclidean Dynamic Time Warping
Because of the robustness of Dynamic Time Warping compared to Euclidean Distance, it is used in… Bioinformatics:Aach, J. and Church, G. (2001). Aligning gene expression time series with time warping algorithms. Bioinformatics. Volume 17, pp 495-508. Robotics:Schmill, M., Oates, T. & Cohen, P. (1999). Learned models for continuous planning. In 7th International Workshop on Artificial Intelligence and Statistics. Chemistry: Gollmer, K., & Posten, C. (1995) Detection of distorted pattern using dynamic time warping algorithm and application for supervision of bioprocesses. IFACCHEMFAS-4 Medicine: Caiani, E.G., et. al. (1998) Warped-average template technique to track on a cycle-by-cycle basis the cardiac filling phases on left ventricular volume. IEEE Computers in Cardiology. Gesture Recognition:Gavrila, D. M. & Davis,L. S.(1995). Towards 3-d model-based tracking and recognition of human movement: a multi-view approach. In IEEE IWAFGR Meteorology/ Tracking/ Biometrics / Astronomy / Finance / Manufacturing …
How is DTW Calculated? (i,j) = d(qi,cj) + min{ (i-1,j-1) , (i-1,j ) , (i,j-1) } C Q C Q Warping path w
DTW is much better than Euclidean distance for classification, clustering, query by content etc. But is it not true that “dynamic time warping cannot be speeded up by indexing *”, and is O(n2)? * Agrawal, R., Lin, K. I., Sawhney, H. S., & Shim, K. (1995). Fast similarity search in the presence of noise, scaling, and translation in times-series databases. VLDB pp. 490-501. Dooh
C C Q Q Global Constraints • Slightly speed up the calculations • Prevent pathological warpings Sakoe-Chiba Band ItakuraParallelogram
A global constraint constrains the indices of the warping path wk = (i,j)k such that j-rij+r Where r is a term defining allowed range of warping for a given point in a sequence. r= Sakoe-Chiba Band ItakuraParallelogram
Lower Bounding We can speed up similarity search under DTW by using a lower bounding function. Algorithm Algorithm Lower_Bounding_Sequential_Scan(Q) Lower_Bounding_Sequential_Scan(Q) Intuition Try to use a cheap lower bounding calculation as often as possible. Only do the expensive, full calculations when it is absolutely necessary. 1. 1. best_so_far best_so_far = infinity; = infinity; for for 2. 2. all sequences in database all sequences in database 3. 3. LB_dist = lower_bound_distance( LB_dist = lower_bound_distance( C C , Q); , Q); i i if if 4. 4. LB_dist < LB_dist < best_so_far best_so_far 5. 5. true_dist = DTW( true_dist = DTW( C C , Q); , Q); i i if if 6. 6. true_dist < best_so_far true_dist < best_so_far 7. 7. best_so_far best_so_far = true_dist; = true_dist; 8. 8. index_of_best_match index_of_best_match = i; = i; endif endif 9. 9. endif endif 10. 10. endfor endfor 11. 11.
C A D B Lower Bound of Kim et. al. LB_Kim The squared difference between the two sequence’s first (A), last (D), minimum (B) and maximum points (C) is returned as the lower bound Kim, S, Park, S, & Chu, W. An index-based approach for similarity search supporting time warping in large sequence databases. ICDE 01, pp 607-614
max(Q) min(Q) Lower Bound of Yi et. al. LB_Yi The sum of the squared length of gray lines represent the minimum the corresponding points contribution to the overall DTW distance, and thus can be returned as the lower bounding measure Yi, B, Jagadish, H & Faloutsos, C. Efficient retrieval of similar time sequences under time warping. ICDE 98, pp 23-27.
What we have seen so far… • Dynamic Time Warping (DTW) is a very robust technique for measuring time series similarity. • DTW is widely used in diverse fields. • Since DTW is expensive to calculate, techniques to speed up similarity search have been introduced, including global constraints and two different lower bounding techniques.
C Q C Q U Q L A Novel Lower Bounding Technique I U L Q Sakoe-Chiba Band Ui = max(qi-r : qi+r) Li = min(qi-r : qi+r) Itakura Parallelogram
C C Q U L Q C Q C U L Q A Novel Lower Bounding Technique II Sakoe-Chiba Band LB_Keogh Itakura Parallelogram
The tightness of the lower bound for each technique is proportional to the length of gray lines used in the illustrations LB_Kim LB_Yi LB_Keogh Sakoe-Chiba LB_Keogh Itakura
Before we consider the problem of indexing, let us empirically evaluate the quality of the proposed lowering bounding technique. This is a good idea, since it is an implementation free measure of quality. First we must discuss our experimental philosophy…
Experimental Philosophy • We tested on 32 datasets from such diverse fields as finance, medicine, biometrics, chemistry, astronomy, robotics, networking and industry. The datasets cover the complete spectrum of stationary/ non-stationary, noisy/ smooth, cyclical/ non-cyclical, symmetric/ asymmetric etc • Our experiments are completely reproducible. We saved every random number, every setting and all data. • To ensure true randomness, we use random numbers created by a quantum mechanical process. • We test with the Sakoe-Chiba Band, which is the worst case for us (the Itakura Parallelogram would give us much better results).
Tightness of Lower Bound Experiment • We measured T • For each dataset, we randomly extracted 50 sequences of length 256. We compared each sequence to the 49 others. • For each dataset we report T as average ratio from the 1,225 (50*49/2) comparisons made. 0 T 1 The larger the better Query length of 256 is about the mean in the literature.
LB_Keogh LB_Yi 1.0 LB_Kim 0.8 0.6 0.4 0.2 0 1 2 3 4 5 6 7 8 9 10 11 12 13 14 15 16 17 18 19 20 21 22 23 24 25 26 27 28 29 30 31 32
Effect of Query Length on Tightness of Lower Bounds 1.0 0.8 0.6 Tightness of Lower Bound T 0.4 31 32 0.2 LB_Keogh 0 LB_Yi 16 32 64 128 256 512 1024 LB_Kim Query Length
These experiments suggest we can use the new lower bounding technique to speed up sequential search. That’s super! Excellent! But what we really need is a technique to index the time series
A Dimensionality Reduction Technique Piecewise Aggregate Approximation (PAA) • Advantages of PAA (for Euclidean Indexing) • Extremely fast to calculate • As efficient as other approaches such as wavelets and Fourier transform (empirically) • Support queries of arbitrary lengths on the same index • Supports weighted Euclidean distance • Simple! Intuitive! C C 0 20 40 60 80 100 120 140 c1 c2 c3 c4 c5 Keogh, E,. Chakrabarti, K,. Pazzani, M. & Mehrotra, S. (2000). Dimensionality reduction for fast similarity search in large time series databases. KAIS. pp 263-286. Yi, B, K., & Faloutsos, C.(2000). Fast time sequence indexing for arbitrary Lp norms. VLDB. pp 385-394. c6 c7 c8
U Q L We create special PAA of U and L, which we will denote and .
hi h1 h2 li l1 l2 Our index structure contains a leaf node U. Let R = (L, H) be the MBR associated with U MBR R = (L,H) L = {l1, l2, …, lN} H = {h1, h2, …, hN} We have seen how to define and We can now define the MINDIST function, which returns the distance between a query Q and a MBR R MINDIST(Q,R)
Algorithm RangeSearch(Q, e, T) Algorithm KNNSearch(Q,K) • if T is a non-leaf node • for each child U of T • if MINDIST(Q,R)e RangeSearch(Q, e, U); • // R is MBR of U • else // T is a leaf node • for each PAA point C in T • if LB_PAA(Q,)e • Retrieve full sequence C from database; • if DTW(Q,C) e Add C to result; 1. 2. 3. 4. 5. 6. 7. 8. • Variable queue: MinPriorityQueue; • Variable list: temp; • 1.queue.push(root_node_of_index, 0); • 2.whilenot queue.IsEmpty() do • 3. top = queue.Top(); • 4. for each time series C in temp • such that DTW(Q,C) top.dist • 5. Remove C from temp; • 6. Add C to result; • 7. if |result| = K return result; • 8.queue.Pop(); • 9. if top is an PAA point C • 10. Retrieve full sequence C from database; • 11. temp.insert(C, DTW(Q,C)); • 12.else if top is a leaf node • 13. for each data item C in top • 14. queue.push(C, LB_PAA(Q,)); • 15.else // top is a non-leaf node • 16. for each child node U in top • 17. queue.push(U, MINDIST(Q,R)) // R is • MBR associated with U. Having defined the MINDIST function we can use (slightly modified) classic K-Nearest Neighbor and Range Queries Seidl, T. & Kriegel, H. (1998). Optimal multi-step k-nearest neighbor search. SIGMOD. pp 154-165.
Pruning Power Experiment • We measured P • We randomly extract 50 sequences of length 256. For each of the 50 sequences we separate out the sequence from the other 49 sequences, then find the nearest match to our withheld sequence among the remaining 49 sequences using the sequential scan • We measure the number of times we can use the fast lower bounding functions to prune away the quadratic-time computation of the full DTW algorithm. • For fairness we visit the 49 sequences in the same order for each approach. 0 P 1 The larger the better Query length of 256 is about the mean in the literature.
16 17 18 19 20 21 22 23 24 25 26 27 28 29 30 31 32 LB_Keogh LB_Yi LB_Kim 1 2 3 4 5 6 7 8 9 10 11 12 13 14 15 16
Effect of Database Size on Pruning Power 1.0 0.8 0.6 Pruning Power P 0.4 31 32 0.2 LB_Keogh 0 LB_Yi 4 8 16 32 64 128 512 LB_Kim Database Size
Experiment on Implemented System System: AMD Athlon 1.4 GHZ processor, with 512 MB of physical memory and 57.2 GB of secondary storage. The index used was the R-Tree Algorithms: We compare the proposed technique to linear scan. LB_Yi does not have an index method and LB_Kim never beats linear scan Metric Definition:TheNormalized CPU cost: The ratio of average CPU time to execute a query using the index to the average CPU time required to perform a linear (sequential) scan. The normalized cost of linear scan is 1.0 • Datasets • Mixed Bag: All 32 datasets pooled together. 763,270 items • Random Walk: The most common test dataset in the literature. 1,048,576 items
Implemented System Experiment 1 Random Walk II Mixed Bag 0.8 LScan LScan 0.6 LB_Keogh LB_Keogh Normalized CPU Cost 0.4 0.2 0 210 212 214 216 218 220 210 212 214 216 218 220 Note that the X-axis is logarithmic
Conclusions • We have shown that DTW is better distance measure than Euclidean distance. • We have introduced a new lower bounding technique for DTW. • We have shown how to index the new lower bounding technique. • We demonstrated the utility of our approach with a comprehensive empirical evaluation.
Questions? Thanks to Kaushik Chakrabarti, Dennis DeCoste, Sharad Mehrotra, Michalis Vlachos and the VLDB reviewers for their useful comments. Datasets and code used in this paper can be found at.. www.cs.ucr.edu/~eamonn/TSDMA/index.html