Download
1 / 54
550 likes | 567 Views
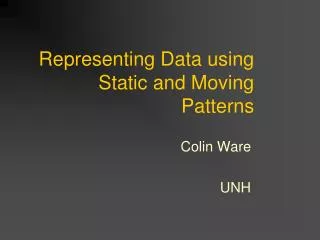
Representing Data using Static and Moving Patterns. Colin Ware UNH. Introduction. Finding patterns is key to information visualization. Expert knowledge is about understanding patterns (Flynn effect) Example Queries: We think by making pattern queries on the world Patterns showing groups?

E N D
Representing Data using Static and Moving Patterns Colin Ware UNH
Introduction • Finding patterns is key to information visualization. • Expert knowledge is about understanding patterns (Flynn effect) • Example Queries: We think by making pattern queries on the world • Patterns showing groups? • Patterns showing structure? • When are patterns similar? • How should we organize information on the screen?
The “What” Channel Patterns of patterns
Two parts • Part I: Static Patterns • Part II: Patterns in Motion
Part I: Static Patterns • Gestalt Laws • [Max Westheimer, Kurt Koffka, and Wolfgang Kohler (1912)] • Proximity • Similarity • Continuity • Symmetry • Closure • Relative Size • Figure and Ground
Proximity • Spatial Concentration • Emphasize relationship by proximity a
Similarity (Continued) • Separable dimensions • Integral dimensions
Connectedness • Connectedness assumed in Continuity
Continuity • Visual entities tend to be smooth and continuous
Continuity in Diagrams • Connections using smooth lines
x b a Graph aesthetics (experiment) In Continuity (inv bendiness)
Results rt = -4.970 + 1.390spl + 0.01699con + 0.654cr + 0.295br spl: Shortest path length con: continuity cr: crossings br: branches 1 crossing adds .65 sec 100 deg. adds 1.7 sec 1 crossing == 38 deg.
Symmetry • Symmetry create visual whole • Prefer Symmetry
Symmetry (cont.) • Using symmetry to show Similarities between time series data
Closure • Prefer closed contours
Closure (cont.) • Closed contours to show set relationship
Closure (cont.) • Segmenting screen • Creating frame of reference • Position of objects judged based on enclosing frame.
Relative Size • Smaller components tend to be perceived as objects • prefer horizontal and vertical orientations
Figure and Ground • Symmetry, white space, and closed contour contribute to perception of figure.
Figures and Grounds (cont.) • Rubin’s Vase • Competing recognition processes
Field, Hayes and Hess Contour finding mechanisms
More Contours • Direct application to vector field display
Vector fields • Contours and pen strokes, 3D, shading
Vector Field Visualization Laidlaw
Evaluation • Direction • Magnitude • Advection • Global pattern • Local pattern • Nodal points
Algorithms • Optimizing trace density (poisson disk) • Flexible methods for rendering (enhanced particle systems).
Transparency • Continuity is important in transparency • x < y < z or x > y > z • y < z < w or y > z > w
Laciness (Cavanaugh) • Layered data: be careful with composites of textures
Patterns in Diagrams • Patterns applied
Treemaps and hierarchies • Treemaps use areas (size) • SP tree • Graph Trees use connectivity (structure) www.smartmoney.com
Part II: Patterns in Motion • How can we use motion as a display technique? • Gestalt principle of common fate
Limitation due to Frame Rate • Can only show motions that are limited by the Frame Rate. • We can increase by using additional symbols.
Motion as a visual attribute (Common fate) • correlation between points: • frequency, phase or amplitude • Result: phase is most noticeable
Motion is Highly Contextual • Group moving objects in hierarchical fashion.
Frame as motion context • The stationary Dot is perceived as moving in (a). • The circle has no effect on this process in (b).
Using Causality to display causality • Michotte’s claim: direct perception of causality
Experiment • Evaluate VCVs • Symmetry about time of contact.
Results Perceived effect
Motion Patterns that attract attention (Lyn Bartram) • Motion is a good attention getter in periphery • The optimal pattern may be things that emerge, as opposed to simply move. • We may be able to perceive large field patterns better when they are expressed through motion (untested)