Download
1 / 9
90 likes | 166 Views
Northeast Pulpwood Production--2001. Iris Baker Bruce Hansen Melody Akers. Trends in pulpwood production from roundwood and manufacturing residues; 1995 to 2001. NE Pulpwood production from roundwood and roundwood chips, 1997 and 2001.

E N D
Northeast Pulpwood Production--2001 Iris Baker Bruce Hansen Melody Akers
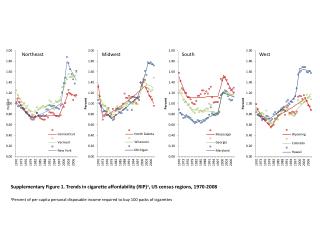
Trends in pulpwood production from roundwood and manufacturing residues; 1995 to 2001
NE Pulpwood production from roundwood and roundwood chips, 1997 and 2001 • Ohio and West Virginia were the only two states where roundwood production increased. However, the increase in Ohio was 21% while the increase in West Virginia was 175% • Maine accounted for over half the NE total of pulpwood production in both 1997 and 2001 at 51% and 54%, respectively • The hardwood to softwood mix for the region increased slightly from 63% hardwood in 1997 to 66% hardwood in 2001 • Of the states producing at least 100 thousand cords in 2001, West Virginia had the highest proportion of hardwoods at 87%. Vermont had the highest percentage of softwoods at 54%.
NE pulpwood production from manufacturing residues, 1997 and 2001 • Pulpwood production from manufacturing residue was down 41% in 2001 from 1997 • Two states, Ohio and New Hampshire, recorded increases in the use of manufacturing residues at 33% and 10%, respectively • The hardwood proportion of manufacturing residues was up dramatically in 2001 from 1997 at 68% versus 53%, resp. The percentage of hardwood in manufacturing residue was close to that of roundwood (66%). • The single largest user of manufacturing residue was Maine at 30%. This was a far smaller regional share for Maine than that of roundwood (54%)
Pulpwood roundwood removals in cubic feet per acre, by state, 1997 and 2001
Intra-regional trade1: Production and consumption of pulpwood roundwood and residues, by state, 2001 1 Production based on mill receipts only; 2 Brackets indicate net importing state; 3 Indicates less than 500 cords;
Inter-regional trade1: Exports to states and Canada outside the Northeast region, by state, in thousand cords, 2001 1 Figures are based on secondary sources outside the region; 2 Less than 500 cords
Intra- and Inter-regional trade1: production and consumption of pulpwood, by state, 2001 1 Result of intra and inter-retional trade; 2 Brackets indicate net importing state; 3 Less than 500 cords
Reported disposition of bark residues, by species and use, 2001 (est. vol. 1.47 million green tons)