Download

1 / 14
140 likes | 265 Views
Ground Deicing Update. Scott Landolt, Roy Rasmussen and Jenny Black. Snow Machine Testing. Current Tasking Laboratory testing of Heavy rates (> 2.5mm/h) and very light rates (< 0.4 mm/h) Indoor testing time versus outdoor testing time variations

E N D
Ground Deicing Update Scott Landolt, Roy Rasmussen and Jenny Black
Snow Machine Testing • Current Tasking • Laboratory testing of Heavy rates (> 2.5mm/h) and very light rates (< 0.4 mm/h) • Indoor testing time versus outdoor testing time variations • Snowfall pattern distribution improvement within the machine
Frost Detection and Diagnosis • Complete testing of various sensing techniques at Marshall • Leaf wetness sensor • Infrared camera • Other methods • Integration into LWE system
Future Checktime • Integrate WSDDM one-hour nowcast or precipitation rate to nowcast holdover/checktime times • Integrate high-resolution model output (HRRR) data into Checktime to forecast holdover times beyond one hour
Measurement of Liquid Fraction during Wet Snow using a dual Hotplate Roy Rasmussenand Scott Landolt National Center for Atmospheric Research (NCAR)
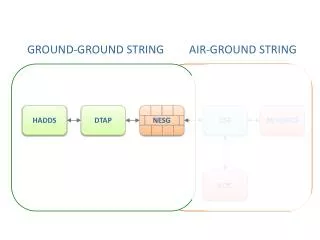
Dual Hotplate System Temperature = 30 C Temperature = 80 C Estimates the total precipitation mass (ice +water) over 5 minutes by sublimating ice +water Estimates the ice mass in snow over 5 minutes by melting the ice only.
Benefits of the new system • Improved holdover time during the most common deicing condition: wet snow • The fraction of ice in wet snow will cool the wing by taking heat out of the wing to melt the ice. The performance of the deicing fluid depends on the temperature of the fluid, and therefore the fraction of ice present.
Deicing in a Future ClimateRoy Rasmussen and Kyoko Ikeda, NCAR
High Resolution Simulations of the Colorado Headwaters snowfall, snowpack and runoff • Perform past climate simulations using high resolution WRF model • Grid spacing: 4 km. • Continuous eight years: 2000 – 2008 • Verified results of WRF integrations using NRCS SNOTEL data and showed that grid spacing of at least 6 km needed to faithfully reproduce the spatial pattern and amount of precipitation (Rasmussen et al. 2011, J. Climate). 3. Investigate enhancement of water cycle by adding CCSM 10 year mean temperature and moisture perturbation from 50 year future A1B simulations from AR4 runs to NARR boundary conditions Headwaters domain Full Domain SNOTEL sites
Model Verification with SNOTEL data SNOTEL Full model domain Headwaters Domain Precipitation gauge Snow pillow • Verifications performed using 93-112 Snowpack Telemetry (SNOTEL) sites over the Headwaters domain. • SNOTEL typically located at elevations between 2600 and 3600 m • Global Historical Climatology Network (GHCN) data at lower elevations for rainfall Orographic Precipitation and Climate Change Workshop, Boulder, CO
7-year average cool-season precipitation : 1 October – 31 May 36 km 4 km OBSERVATIONS 1000 900 800 700 600 Precipitation (mm) 500 400 300 200 100 0 USBR-USACE meeting
Four kilometer horizontal resolution climate simulations will be conducted for 13 years in the past and 13 years in the future (centered on 2050) over the domain below using the WRF model using the Thompson et al. microphysics allowing precipitation type and rate to be determined with good accuracy (1360 x 1016 grid points)
RUN2 RUN1 Test 4 km WRF model estimate of precipitation for March, 2001 PRISM March