Download
1 / 92
930 likes | 1.07k Views
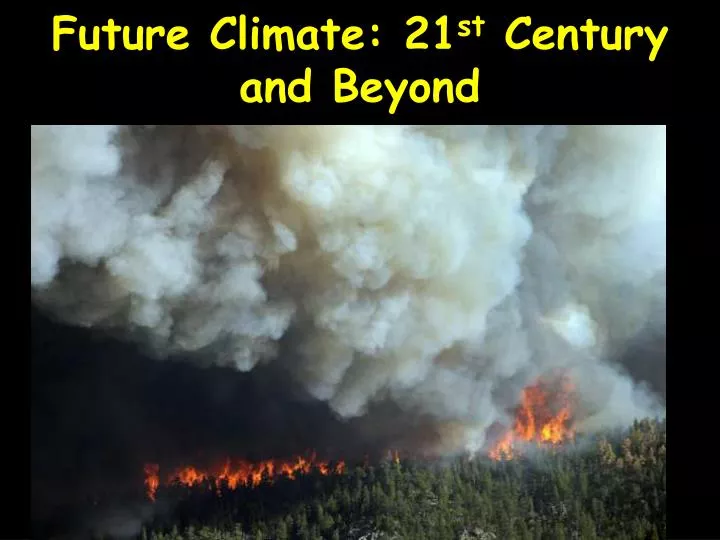
Future Climate: 21 st Century and Beyond. The Future…. 1. The irreversibility of climate change on human time scales. 2. Sea Level Rise. New predictions 3. Ocean acidification 4. Methane hydrate, permafrost methane stability 5. Regional Forecasts, including California

E N D
The Future… • 1. The irreversibility of climate change on human time scales. • 2. Sea Level Rise. New predictions • 3. Ocean acidification • 4. Methane hydrate, permafrost methane stability • 5. Regional Forecasts, including California • 6. Societal instability, extinction rates • 7. Runaway Greenhouse odds • Rapidity of the change is what is so devastating, not just the absolute value of the eventual change. Ecosystems cannot adapt this fast. Human society may not be able to adapt either
1. CO2-Induced Climate Change is Irreversible for Thousands of Years • Solomon et al. 2009(and others, e.g. Port et al. 2012) show that CO2 added to the atmosphere only very slowly is soaked up by the ocean and land, and ocean thermal mass and inertia mean that climate change is irreversible on any human time scale. • Newest study says 20,000 – 200,000 years for climate to return to pre-industrial conditions • It is probably worse… Solomon et al. uses IPCC AR4 2007 climate models as starting point. These are, as we know now, overly optimistic. They also do not include permafrost and peat release of methane, or continental glacier acceleration due to meltwater at the base, nor iceberg travel south out of the Arctic Ocean. We will look at some of those later. • One caveat – in an interview, Solomon acknowledged that if somehow CO2 could be pulled OUT of the atmosphere on a grand scale, this would be a solution, if it were done soon enough, before too much diffused into the oceans. • Charts from this study…
Atmospheric CO2 – Next 1000 years. Peaks are Assumed Moments of Zero Further Emissions. CO2 slowly declines over centuries, …but not temperatures (see later slide)
Why Don’t CO2 Levels Fall Faster when Emissions Stop? • Because on a warmer planet… • 1. CO2 does not absorb well into a hotter ocean - a hotter ocean can hold less dissolved CO2 • 2. Marine plants and animals are much less able to convert dissolved CO2 to CaCO3 under rising acidity • 3. The sheer time scale of mixing CO2 into the ocean. Complete ocean mixing takes ~1000 years. • 4. Thermal inertia of the oceans. Remember, we saw that 93% of the heat of global warming has gone into the oceans. That heat hasn’t gone away, it’s still there, and being added to every day.
93% of the Heating Has Been Transmitted Ultimately into the Oceans, Where it will Reside for Thousands of Years.
Oceans Soak Up CO2 Better Early On, Then as it Warms, Not So Much. Note We Don’t Achieve Thermal Equilibrium Until ~400 years after CO2 Cessation
Therefore, Temperatures Don’t Fall, Even After CO2 Emissions Halt – for Thousands of Years (Solomon et al. 2009).
Climate Forcing and Equilibrium • Think of a glass of cold 40F water being placed in a sauna room. • The water takes time to warm up to the 105F temperature of the sauna. The heat diffuses into the water because there is “climate forcing” being applied to it from the hotter air around it. • Its temperature continues to rise until, a couple of hours later, the water in the glass has reached a temperature of 105F, and then there is radiative equilibrium: There is as much heat flow leaving the water as there is heat flow into the water. Only then does the water temperature stop changing. • The Earth is NOT in radiative equilibrium. We are forcing it to higher temperatures by reducing the atmosphere’s thermal conductivity by adding CO2 and higher humidity. If we STOP forcing the conductivity lower, the surface will still not be in equilbrium. It will take many decades until the atmosphere is hot enough to again be radiating as much heat as we get from the sun. During that time, we are doomed to further heating. That heating can be either rapid, or slow, depending on our actions – but continue to heat up, we will. • Add in the much longer thermal inertia of the ocean, and how much of the additional heating we have caused which has ended up in the oceans, and one can see that the time scale for equilibrium with the ocean is of order thousands of years. • To have hope of returning to a cooler climate, we must think about more than just reducing the rate of damage, more than even completely stopping the CO2 input damage, we must think about rapidly reversing the damage, if that is possible.
From of Fasulo & Trenberth (2012) (Digest here) • (my note:“Earth climate sensitivity” = ECS = how much hotter Earth surface temperatures will be, in equilibrium, at double the pre-industrial CO2 levels - a convenient benchmark used to discuss future prospects.) • “In short, while FS12 does not provide a specific measurement of climate sensitivity, it does suggest that the climate models with lower sensitivity ( 'low' here refers to approximately 2 to 3°C surface warming in response to doubled CO2, not the ridiculously low estimates of 1°C or less proposed by contrarians like Lindzen) are not accurately representing changes in cloud cover, and are therefore biased. Climate models with higher sensitivity - in the 3 to 4.4°C ECS range for doubled CO2 - more accurately simulate the observational RH (relative humidity) data and thus the response of subtropical clouds to climate change.” (Fasulo & Trenberth 2012) • (continued on next page)
“If climate sensitivity is on the higher end of the likely range, it does not bode well for the future of the climate. As Fasullo told The Guardian, "our findings indicate that warming is likely to be on the high side of current projections." • In terms of warming over the 21st Century, we are currently on track with IPCC emissions scenario A2, which corresponds to about 4°C warming above pre-industrial levels by 2100 if ECS is around 3°C for doubled CO2. • Note that's the warming models expected by the year 2100, but at that point there will still be a global energy imbalance, and thus additional warming will remain 'in the pipeline' until the planet reaches a new equilibrium. An even higher ECS would correspond to even more warming, but anything greater than 4°C would almost certainly be catastrophic.”
Conclusions from Solomon et.al. 2009 • Anthropogenic Global Warming is largely irreversible for more than ~1,000 years after emissions stop. • Following cessation of emissions, removal of atmospheric carbon dioxide decreases radiative forcing, but is largely compensated by slower loss of heat to the ocean, so that atmospheric temperatures do not drop significantly, even out 1,000 years into the future which they calculated. • Among illustrative irreversible impacts that should be expected if atmospheric carbon dioxide concentrations increase from current levels near 385 parts per million (now in 2013 it’s 400 ppm) by volume (ppmv) to a peak of 450–600 ppmv over the coming century are irreversible dry-season rainfall reductions in many regions (including western U.S. ) comparable to those of the ‘‘dust bowl’’ era and inexorable sea level rise. • Thermal expansion alone, even neglecting melting of continental ice produces irreversible global average sea level rise of at least 0.4 –1.0 m if 21st century CO2 concentrations exceed 600 ppmv and 0.6 –1.9 m for peak CO2 concentrations exceeding 1,000 ppmv. Sea level rise does not stop there, it continues to rise. • Additional contributions from melting glaciers and ice sheet contributions to future sea level rise are uncertain but may equal or exceed several meters over the next millennium or longer.
This graph considers thermal expansion of ocean water only. Temperatures held this high for this long will cause much of continental land ice to melt, increasing sea level much more than shown here
But Won’t CO2 “Fertilization” Sequester More Carbon, Looking on the Bright Side? • Port et al. (2012)model effect on vegetation from predicted CO2 rises • They find fertilization due to rising CO2 causes boreal forests to spread north, deserts to slightly shrink. • By including the rise in carbon sequestered by CO2-fertilized plants, the reduction in greenhouse warming is 0.22 C • 0.22C drop, however, is only a tiny dent in the net ~6 C rise in global temperatures • And new work in 2013 says this is probably too optimistic, since it fails to include the effect of heating and drying on the soil microbes which fix nitrogen so that it is available to plants… most plants are NITROGEN-LIMITED, not carbon-limited
The Rate of Sea level Rise Itself continues to Accelerate as Land Ice Melting Accelerates Observed rate of sea-level rise (red) compared with reconstructed sea level calculated from global temperature (dark blue with light blue uncertainty range). Grey line is reconstructed sea level from an earlier, simpler relationship between sea level and temperature (Vermeer 2009)
The IPCC AR4 2007 modelling of glaciers did not include the effect of meltwater on lubricating the glacier/soil interface. When real-world data is used to include this effect… sea level rise is much worse, and clearly is still accelerating in year 2100(Vermeer and Ramstorff 2009). And latest (2013)
Eventually…. from Raymo et. al. 2012 • (from the paper’s Abstract) - “… observations of Pleistocene shoreline features on the tectonically stable islands of Bermuda and the Bahamas have suggested that sea level about 400,000 years ago was more than 20 meters higher than it is today. Geochronologic and geomorphic evidence indicates that these features formed during interglacial marine isotope stage (MIS) 11, an unusually long interval of warmth during the Ice Ages • “Here we show that the elevations of these features are corrected downwards by 10 meters when we account for post-glacial crustal subsidence of these sites over the course of the anomalously long interglacial. On the basis of this correction, we estimate that eustatic sea level rose to 6–13m above the present-day value in the second half of MIS 11. • That’s 20-40 feet • This suggests that both the Greenland Ice Sheet and the West Antarctic Ice Sheet collapsed during the protracted warm period while changes in the volume of the East Antarctic Ice Sheet were relatively minor, thereby resolving the long-standing controversy over the stability of the East Antarctic Ice Sheet during MIS 11.” • Given the permanence of the climate change we are causing, it is quite possible, even likely, that a similar collapse of the Greenland and Antarctic ice sheets is also in our future.
Bottom Line from Raymo et. al. • During interglacial period MIS 11, oxygen-18 T proxy data shows global temperatures were ~identical to today’s (source; p 457). • Allowing temperatures to remain at today’s levels may therefore lead to not just the loss of all permanent Arctic Ocean ice (which has now essentially already happened) but to the relentless melting of all Arctic ice, thence to the large sea level rises seen by Raymo et al. in MIS 11. • Here’s another source on the future of the Arctic…
Milankovitch insolation (middle graph) predicts stable Northern Hemisphere (NH) ice volume (dotted) at pre-industrial 210 ppm CO2. If instead we continue raising CO2 to ~double present values, all NH ice disappears for about 20,000 years until Milankovitch cooling begins again. source, p. 459
In 2012 for the first time on record, Greenland had surface melting across its entire surface, even the colder, high altitude inland. It is projected that by next year the clean highly reflective new snow layers in summer will show much larger areas of older and darker (due to wildfire ash, pollution, etc) ice layers, markedly reducing its reflectivity and hence absorbing sunlight with consequent higher melting rate. See Box et al. 2012for the declining albedo of the Greenland ice cap. If/When Greenland melts entirely, it will contribute 7m to global sea level.
More Comprehensive Studies: Sea Level Rise will be Worse • Raymo et al. Studied just one location to get these sobering sea level rise levels. • A year later, Foster and Rohling (2013) published a work consolidating evidence from the past ~40 million years at many locations to determine sea level rise at thermal equilibrium (when climate has finally stabilized at a given new CO2 level) for various CO2 levels • They find that at CO2 of 400 ppm (today’s level), sea level will rise at least 9m and most likely ~24m above present levels, due to complete melting of Greenland, and the West Antarctic Ice Sheet, and part of the remainder of Antarctica as well. • 24m is 80 feet, submerging the large majority of coastal cities and millions of square miles of continental area, including much prime farmland in delta regions.
Paleo Climate shows that 400 ppm CO2 leads to final sea level rise of ~24m (80 ft) above today’s.
Sea Levels for the Future: Much Higher • For temperature rises comparable to what current global warming will produce, the evidence is that both the Greenland and West Antarctic ice shields completely collapsed in MIS 11, sending sea levels rising 6-13m (20-40 ft). • More comprehensive studies from Foster et al. 2013 show the most likely equilibrium sea level rise is even higher: 24 meters = 80 feet • These levels would completely devastate most of the world’s great cities, which are sited on the coast. • It will also submerge many island nations and large areas of valuable agricultural land
21st Century Ocean Acidification • Even using the overly conservative 2007 IPCC scenarios, by the year 2050 the oceans will be too acidic for the survival of coral reefs, and they will disappear • Coral reefs to dissolve when CO2 doubles from pre-industrial levels (Silverman et.al. 2009) • Shellfish reproductive failuresdue to acidification have already arrived. • At higher levels, the entire food web of the ocean is endangered, as many species of microbes, plants, and animals use calcium carbonate exoskeletons which cannot be made in too-acidic oceans • Loss of calcarious marine life also means drastically reduced ability to fix CO2 into CaCO3 and remove it from the biosphere and atmosphere later during the ocean conveyor. • Already, primary productivity in the oceans has dropped 40%
4. Weather Intensity Changes • Warmer Sea Surface Temperatures Mean… • --- more evaporation • --- stronger vertical air temperature gradient driving convection • This drives stronger storms • Warmer Air Temperatures Mean… • --- air can hold more water vapor, so rain is less frequent. 7% higher saturation humidity per 1 degree C. • --- however, when saturation of the air does take place, the rarer resulting rains will be more forceful because of the higher amounts of water • --- floods far more common, as higher air temps mean more precip falls as rain now instead of snow, which runs off rapidly rather than being stored for weeks or months as snow in the mountains. • We are transitioning from a time of frequent, gentle rains which allow soaking of the soil and plant roots, to a time of rarer rains, parched dry land with less healthy plants, and severe erosion caused by stronger deluges when rain does occur
From Coumous and Rahmstorff (2012) – Atlantic sea surface temperatures (SST’s) strongly correlated with tropical storm power. SST’s strongly correlated with global surface air temperatures
More Severe Weather in Northern Hemisphere • Melting Arctic Ocean ice -> darker surface -> more solar radiation absorbed -> excess heat released especially in Autumn • This decreases the temperature gradient and pressure gradient across the jet stream boundary of the Polar Cell between the Arctic and middle latitudes
Weaker Polar Cell = Meandering Polar Jet Stream • This diminished north/south pressure gradient is linked to a weakening of the winds associated with the polar vortex (Polar cell) and polar jet stream. • This weakened polar jet stream has larger loops in it, and it is the loops especially which cause large storms. • The loops also are longer-lived, and as the southern ends can extend further south now, they make for more frequent slow-moving intense winter storms, and at the same time, longer and more extreme heat waves, depending on where you are in these meandering loops • The larger “loops” in the polar jet stream also mean that storms move slower, delivering more energy to any given location.
Negative Arctic Oscillation conditions are associated with higher pressure in the Arctic and a weakened polar vortex (yellow arrows). A weakened jet stream (black arrows) is characterized by larger-amplitude meanders in its trajectory and a reduction in the wave speed of those meanders.
The Polar Jet Stream and Weather • Dr. Jennifer Francis: A 2 hr lecture on weather and its connection to disappearing polar ice • A 5 minute section of this larger 2 hr lecture, which covers the why/how the polar jet stream is changing • Good visuals in this video (0:55 to 6:20) interview with Dr. Jennifer Francis
5. Worst of all: Methane Release from the Permafrost • Albedo effect from an ice-free Arctic warms the entire Arctic far inland, where vast amounts of methane is stored in the permafrost • Nobel Physicist Steven Chu on permafrost methane and climate (1m:35s video) • Arctic will become major carbon source via methane release from permafrost by 2020’s Shaefer et al. (2011) and summarized here. Study estimates 30-60% of permafrost will be melted and its methane released by year 2200.
Methane (hydrates) in the Permafrost – Global Climate Implications • The release of methane from the Arctic is in itself a contributor to global warming as a result of polar amplification. Recent observations in the Siberian Arctic show increased rates of methane release from the Arctic seabed.[4] Land-based permafrost, also in the Siberian arctic, was also recently observed to be releasing large amounts of methane, estimated at over 4 million tons – significantly above previous estimates.[11] • Atmospheric methane levels are at levels not seen for at least 650,000 years (IPCC ’07), and are over twice the pre-industrial levels
Methane levels have accelerated far above the regular oscillations during the Ice Ages
Methane levels stable for the past millenium – until about 1850
Methane levels up 17% in just the last 34 years, and re-accelerating this past decade as the dramatic Arctic melt thaws the permafrost
Why the decreasing CH4 Rise Rate in the late 1990’s/early ’00’s? • Reason for the slowing CH4 rise rate in 1990’s is thought to be the breakup of the Soviet Union and resulting lowered production of fossil fuels, and also lowered methane loss from wetlands due to drought (NOAA source). • Droughts are expected to increase, yet wetland methane emissions are not predicted to continue to slow, because of spreading wetlands in the far north, as the permafrost melts. • Methane sinks: reaction with OH to produce H2O and CO2, and smaller sink is reactions with chlorine. Note that in the troposphere, reaction of methane with OH is by far the dominant sink, and the residence time for a given molecule is about 9 years. • In other words, without methane release from fossil fuels and from other sources, methane levels would drop fairly quickly. See table on next page. • However, the source/sink actual numbers vary somewhat between different studies by different authors (see IPCC 2007)
From Houweling et.al. 1999 However the imbalance has recently clearly increased
The Bad News… • Current methane release has previously been estimated at 0.5 Mt per year.[12] Shakhova et al. (2008) estimate that not less than 1,400 Gt of carbon is presently locked up as methane and methane hydrates under the Arctic submarine permafrost, and 5-10% of that area is subject to puncturing by open taliks They conclude that "release of up to 50 Gt of predicted amount of hydrate storage [is] highly possible for abrupt release at any time". • That would increase the methane content of the planet's atmosphere by a factor of twelve (!).[13] • In 2008 the United States Department of Energy National Laboratory system[14] identified potential clathrate destabilization in the Arctic as one the most serious scenarios for abrupt climate change, which have been singled out for priority research. The U.S. Climate Change Science Program released a report in late December 2008 estimating the gravity of the risk of clathrate (another name for hydrate) destabilization, alongside three other credible abrupt climate change scenarios.[15] • You should find these studies are alarming
Worse… • NewScientist states that "Since existing models do not include feedback effects such as the heat generated by decomposition, the permafrost could melt far faster than generally thought."[20]
Schaefer et. al. (2011)Carbon released as CH4 (methane), which converts to CO2 + H2O over time. Because of this reaction, it is 25 times more powerful as GHG averaged over a century, but 72x more powerful when averaged over 20 years. This study assumed human carbon emissions end in the year 2100. Note that permafrost carbon flux remains positive (although decreasing) even after human carbon emissions are assumed to stop in year 2100
From Shaefer et al. (2011) - Conclusions Section Quoted Here… “The thaw and release of carbon currently frozen in permafrost will increase atmospheric CO2 concentrations and amplify surface warming to initiate a positive permafrost carbon feedback (PCF) on climate…. [Our] estimate may be low becauseit does not account for amplified surface warming due to the PCF itself…. We predict that the PCF will change the Arctic from a carbon sink to a source after the mid-2020s and is strong enough to cancel 42-88% of the total global land sink.” (RN: Recall from our Carbon Cycle lectures that land+ocean take up about half of human-caused CO2 emissions currently) “The thaw and decay of permafrost carbon is irreversible and accounting for the permafrost carbon feedback will require larger reductions in fossil fuel emissions to reach a target atmospheric CO2 concentration.”
The Arctic loses essentially all of its permafrost within ~200 years (SvD 2012)