Download
1 / 26
260 likes | 418 Views
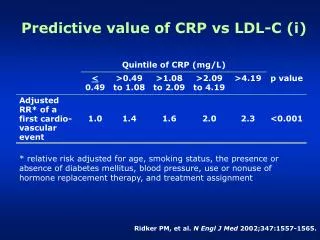
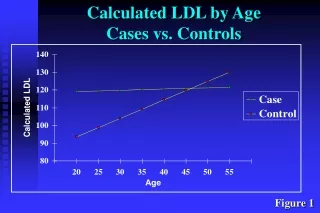
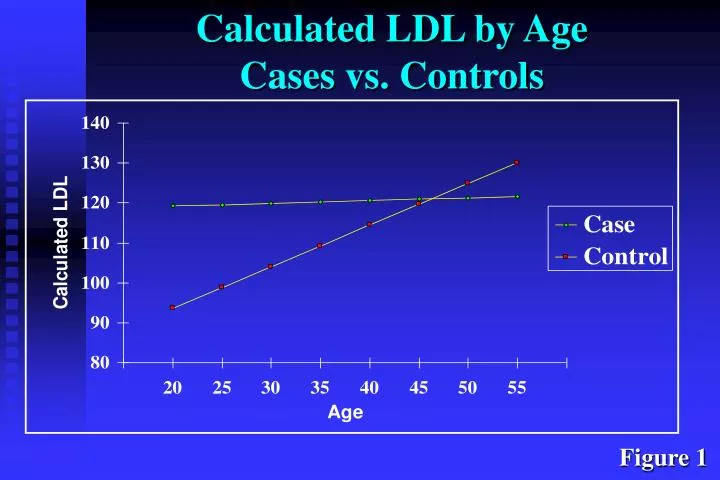
Calculated LDL by Age Cases vs. Controls. Figure 1. HDLT by Age Cases vs . Controls. Figure 3. Triglycerides by Age Cases vs. Controls. Figure 5. Insulin by Age Cases vs. Controls. Figure 6. Androstenedione by Age Cases vs. Controls. Figure 7. Clinic BMI by Age Cases vs. Controls.

E N D
HDLT by AgeCases vs. Controls Figure 3
Insulin by AgeCases vs. Controls Figure 6
Clinic BMI by AgeCases vs. Controls Figure 8
Study Population:PCOS and the Risk of CHD,Part II (l996-99) • 160 PCOS cases and 160 controls 30+ years of age participating in PHASE II (1996-1999) of the Cardiovascular Health and Risk Measurement (CHARM) Study • Ongoing protocol to evaluate the CHD risk factors and subclinical atherosclerosis as measured by carotid ultrasound in women with PCOS.
Research Methodology • Clinic Visit (continued) • Blood analyte assessment • Lipids ( total cholesterol, triglycerides, LDLc, HDLc) • Fasting glucose and insulin • Fibrinolytic/coagulation parameters • tissue plasminogen activator (tPA) • plasminogen activator inhibitor (PAI-1)
Carotid Atherosclerotic Index (CAI) • Represents the overall mean of the mean measurements of carotid intima-media thickness at 8 sites • Arterial sites of interest included : • left/ right proximal common carotid • left/ right distal common carotid • left/ right carotid bulb • left/ right distal internal carotid
Baseline Demographic and Reproductive Factors in PCOS Click for larger picture Arteriosclerosis, Thrombosis, and Vascular Biology, 2000;20:2414-2421
BaselineCardiovascularRisk Factors in PCOS Arteriosclerosis, Thrombosis, and Vascular Biology, 2000;20:2414-2421 Click for larger picture
Plaque Indexed was also scored: Plaque was defined as a distinct area protruding into the vessel lumen with at least 50% or > thickness than the surrounding area. Scoring was as follows: 0= no stenosis, 1 = small stenosis <30% of vessel area, 2= 1 medium stenosis between 30-50% of vessel area or multiple small stenoses and 3=1 large stenosis >50% or multiples with at 1 medium stenosis. These were summed to create an overall plaque index.
Plaque Index in PCOS Click for larger picture Arteriosclerosis, Thrombosis, and Vascular Biology, 2000;20:2414-2421
Carotid IMT in PCOS by Age and BMI ns ns .219 .040 BMI: Age: < 45 years > 45 years
Univariate Regression of IMT and Baseline CHD Risk Factors- summary • Risk factors included: • PCOS, BMI, hormone use, smoking status, LDL, HDL, DBP, SBP, insulin, W:H, age, total T, and TRIG • In the total group and less than 45 years of age, significant risk factors included: • BMI, DBP, SBP, insulin, W:H, age, TRIG • In women 45 years or greater, significant risk factors included: • PCOS, BMI, LDL, SBP, insulin, TRIG Arteriosclerosis, Thrombosis, and Vascular Biology, 2000;20:2414-2421
Regression Modeling of IMT in PCOS Women and Controls 45 years Models 1 PCOS Age 2 PCOS Age BMI 3 PCOS Age BMI LDL Beta .309 .021 .206 .022 .017 .227 .020 .014 .003 SE .095 .013 .100 .013 .006 .099 .013 .006 .002 Sig .002 .107 .042 .092 .008 .024 .124 .030 .048 Arteriosclerosis, Thrombosis, and Vascular Biology, 2000;20:2414-2421
Regression Modeling of IMT in PCOS Women and Controls 45 years (cont.) Models 4 PCOS Age BMI SBP 5 PCOS Age BMI DBP 6 PCOS Age BMI TRIG Beta .174 .013 .016 .002 .178 .014 .017 .002 .195 .021 .016 .033 Sig .088 .322 .037 .535 .085 .287 .024 .699 .068 .113 .030 .716 SE .101 .013 .007 .004 .102 .013 .007 .006 .105 .013 .007 .090 Arteriosclerosis, Thrombosis, and Vascular Biology, 2000;20:2414-2421
Regression Modeling of IMT in PCOS Women and Controls >45 years (cont.) Models 7 PCOS Age BMI W:H 8 PCOS Age BMI Insulin SE .104 .013 .006 .309 .109 .013 .008 .094 Sig .112 .314 .007 .883 .256 .094 .034 .471 Beta .167 .014 .018 .045 .124 .023 .018 .068 Arteriosclerosis, Thrombosis, and Vascular Biology, 2000;20:2414-2421
Multivariate Regression Models of IMT- Effect of PCOS • Models adjusted for age and BMI • Risk factors explored include: • PCOS, LDL, SBP, DBP, TRIG, W:H, insulin • In the total group PCOS was not a significant predictor of IMT. SBP was only significant independent predictor. • In women less than 45 years of age PCOS was not a significant predictor of IMT. SBP and DBP were significant independent predictors. Arteriosclerosis, Thrombosis, and Vascular Biology, 2000;20:2414-2421
Multivariate Regression Models of IMT- Effect of PCOS (cont.) • In women 45 years or greater PCOS was a significant predictor of IMT, independent of age and BMI (p=.042). • With the addition of LDL, this relationship became more significant (p=.024). Both LDL and PCOS exerted independent significant effects. • With the addition of SBP, DBP or TRIG, the PCOS-IMT relationship remained borderline significant (p=.068-.088). • The addition of insulin or W:H eliminated the significance of PCOS as an independent predictor of IMT. Arteriosclerosis, Thrombosis, and Vascular Biology, 2000;20:2414-2421
Regression Summary: • Fasting insulin and W:H appear to attenuate the relationship of PCOS and IMT, suggesting that at least part of the PCOS-IMT association in middle aged PCOS women may be driven by central obesity and hyperinsulinemia. • There may be an independent effect of PCOS on IMT mediated by low peak estradiol levels or hormonal dysregulation. • An increase in IMT is apparent even in thinner PCOS cases. Arteriosclerosis, Thrombosis, and Vascular Biology, 2000;20:2414-2421
Calcification Scores in PCOS Click for larger picture
Conclusions: • The epidemiologic studies to date have been mainly consistent in their findings of increases in cardiovascular risk factors in women with PCOS. These have however been largely cross-sectional. • Subclinical measures have shown increases in women >45 and this would imply a common source long incubation “latency” effect of increases in CHD RF in younger PCOS women over time. • However, a prospective study following a larger cohort of women with PCOS is needed to determine if there is a true increased risk of CHD events.