Download
1 / 37
380 likes | 452 Views
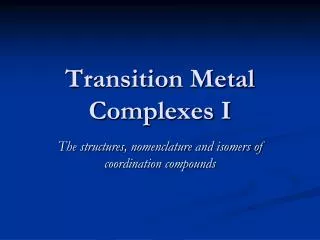
1. Engineering and Physical Sciences Research Council. CP-FTMW Spectroscopy of Metal-containing Complexes. Nicholas R. Walker , Susanna L. Stephens, Anthony C. Legon. Max-Planck Advanced Study Group at the Center for Free Electron Laser Science. 22 nd September, 2011. Introduction.

E N D
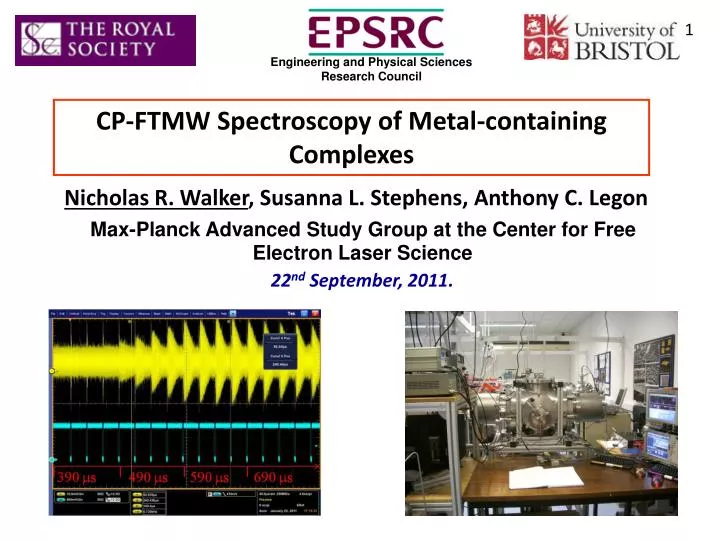
1 Engineering and Physical Sciences Research Council CP-FTMW Spectroscopy of Metal-containing Complexes Nicholas R. Walker, Susanna L. Stephens, Anthony C. Legon Max-Planck Advanced Study Group at the Center for Free Electron Laser Science 22nd September, 2011.
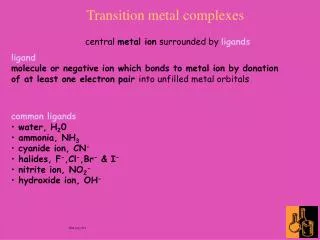
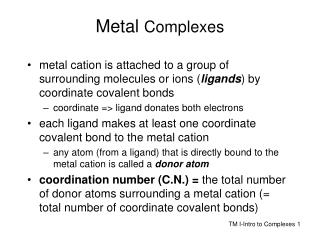
Introduction • Microwave spectroscopy provides high precision in the determination of molecular geometries and hyperfine parameters. Can also provide insight into barriers to internal rotation and internal dynamics. • Recently completed construction of a chirped pulse Fourier transform microwave (CP-FTMW) spectrometer at the University of Bristol. The instrument benefits from recent advances in electronics that allow direct digitisation of waves at GHz frequencies. • Present results from complexes of CF3I that illustrate the capabilities of the spectrometer. • 4) Show how the CP-FTMW spectrometer is being applied to the study of metal-containing complexes.
7 Animation:Prof. Wolfgang Jäger, Dept. of Chemistry, University of Alberta, Edmonton, AB, CANADA, T6G 2G2.
Pin diode limiter 300 W Power amplifier SPST switch Adjustable attenuator Low noise amplifier 7.0 - 18.5 GHz 7.0 - 18.5 GHz Power divider Mixer Mixer 12.2 GHz Low - pass band filter PDRO (19.00 GHz) Oscilloscope (0 - 12 GHz) 10 MHz reference frequency AWG (0.5 - 12 GHz) CP-FTMW Spectrometer
Small percentage of OCS in 2 bar of helium. Multiple Free Induction Decay Acquisition per Valve Pulse Faraday Discuss., 2011, 150, 284–285
Crystal Engineering with Halogen Bonds E. Corradi, S. V. Meille, M. T. Messina, P. Metrangolo and G. Resnati, Tetrahedron Lett. 1999, 40, 7519-7523. V. Amico, S. V. Meille, E. Corradi, M. T. Messina and G. Resnati, J. Am. Chem. Soc. 1998, 120, 8261-8262.
CF3I CF3INH3 ?? CF3INH3
Internal rotation? C3v Symmetric top ? [1] G. T. Fraser, F. J. Lovas, R. D. Suenram, D. D. Nelson, Jr. and W. Klemperer, J. Chem. Phys. 1986, 84, 5983-5988. [2] G. Valerio, G. Raos, S. V. Meille, P. Metrangolo and G. Resnati, J. Phys. Chem. A, 2000, 104, 1617-1620. The Hamiltonian
Simulation and fitting using PGOPHER (2010, version 7.0.103), a Program for Simulating Rotational Structure, C. M. Western, University of Bristol, http://pgopher.chm.bris.ac.uk. Exp. [80 kHz FWHM] Sim. 13850 13860 13870 Energy/MHz CF3I14NH3 Total (A and E)sim. E species sim. A species sim. 13850 13855 13860 13865 13870 13875 Energy/MHz
Exp. Sim . 10150 10160 10170 Energy/MHz CF3I14NH3 CF3I15NH3
8790 8800 8810 8820 8830 8840 Energy/MHz CF3I CF3I14N(CH3)3 Exp. CF3I14N(CH3)3 A and E species sim.
Structure implies = 20.5(12) for CF3INH3 and = 16.2(20) for CF3IN(CH3) 3.054 Å > rNI > 3.034 Å for CF3INH3 where 30>>0 and 8>>0 2.790 Å > rNI > 2.769 Å for CF3IN(CH3)3 where 30>>0 and 8>>0
E. Corradi, S. V. Meille, M. T. Messina, P. Metrangolo and G. Resnati, Tetrahedron Lett. 1999, 40, 7519-7523. rNI=2.84(3) Å. V. Amico, S. V. Meille, E. Corradi, M. T. Messina and G. Resnati, J. Am. Chem. Soc. 1998, 120, 8261-8262. rNI close to 2.80 Å. 3.054 Å > rNI > 3.034 Å for CF3INH3 where 30>>0 and 8>>0 2.790 Å > rNI > 2.769 Å for CF3IN(CH3)3 where 30>>0 and 8>>0 Correspondence with solid state
H2SICF3 Spectrum assigned using a symmetric top Hamiltonian. H2OC6H6 and H2SC6H6 [1] E. Arunan et al.J. Chem. Phys., 2002, 117, 9766-9776. [2] S. Suzuki et al.Science, 1992, 257, 942-945. [3] H. S. Gutowsky et al.J. Chem. Phys., 1993, 99, 4883-4893. [4] H. Ram Prasad et al.J. Mol. Spectrosc. 2005, 232, 308-314. H2O CF3Cl and H2OCF4 [5] W. Caminati, A. Maris, A. Dell’Erba and P. G. Favero, Angew. Chem. Int. Ed. 2006, 45, 6711 –6714. [6] L. Evangelisti, G. Feng, P. Écija, E. J. Cocinero, F. Castaño and W. Caminati, Angew. Chem. Int. Ed., (in press). Exp. Sim.
H2OICF3 Superposition of spectra assigned using symmetric and asymmetric top Hamiltonian’s, respectively. Total sim. Sym. Asym. Exp. Total sim.
Laser ablation source Laser ablation source informed by the designs currently used by Duncan and co-workers, Gerry and co-workers, Ziurys and co-workers.
OCAgI 10 9 107 AgI AgI CF I 3 Ag I 8000 10000 12000 14000 16000 18000 Frequency/MHz
OCAgI 109 OC AgI L 107 OC AgI L 109 107 AgI AgI Exp. Sim . OC ICF L 3 13200 13400 13600 13800 14000 14200 14400 Frequency / MHz
Conclusions • CP-FTMW spectroscopy has greatly accelerated the speed at which it is possible to measure and analyse rotational spectra. • In the first year of full operation, the spectra of NH3ICF3, N(CH3)3ICF3, H2OICF3, H2SICF3, OC ICF3, Kr ICF3 have been analysed and described in a series of papers. (Two papers in press with PCCP, one paper in press with JCP). • The spectra of OCAgI and H2SAgI have been measured and the molecular geometries have been determined. Further analysis and theoretical calculations are in progress. • Future applications in molecular dynamics and analytical chemistry seem possible.
Acknowledgements University of Bristol Susanna Stephens Tony C. Legon Colin M. Western David P. Tew University of Virginia Brooks H. Pate Stephen T. Shipman University of Sheffield Michael Hippler Financial Support University of Oxford Brian Howard Engineering and Physical Sciences Research Council
1981 – cavity FT-MW spectroscopy (Balle and Flygare). Explore intermolecular potentials. Pre-reactive complexes Hydrogen and van der Waals bonding. 3 1946 - First high resolution spectroscopic measurements using microwaves (B. Bleaney). 1950 1954 – Invention of the Maser (Gordon, Zeiger and Townes). 1960 1968 – First polyatomic molecule identified in space is NH3. 1970 1980 1990 2000 2002 – rotational spectra of OCS in He droplets
532 nm Lens Ar/H2O/CCl4 supersonic expansion Nozzle and Cu rod Pump 6 Experimental Ar/H2O/CCl4
Balle-Flygare FTMW Spectrometer Fabry-Perot Resonator Parallel Propagation 350 mm diameter 840 mm curvature radius ~700 mm distance aluminum e 20 MHz 10 MHz MW Amplifier Single Sideband modulator Frequency Doubler SPDT switch Adjustable frequency (6 ≤ e ≥ 18 GHz) -20 MHz 10 MHz e - 20 MHz e MW Signal generator SPDT switch Attenuators e - 20 MHz m Image rejection mixer Low Noise Amplifier SPDT switch m (m - e) +20MHz =Δ +20MHz Low Band Pass Filter 10 MHz Δ +20MHz MW Signal Generator 20 MHz RF Mixer +Δ Pre-amp Digitiser and computer
CF3I But what’s this stuff ???? 3 hours of averaging, CF3I, CO and Ar gas sample
CF3I But what’s this stuff ???? 6 hours of averaging, CF3I, N(CH3)3 and Ar gas sample
C2H4ICF3 Exp. Total sim. Prof. Brian Howard, University of Oxford Exp. Total sim. Asym. Sym. 11280 11300 11320 11340 11360 11380 Energy/MHz
13300 13400 13500 13600 13700 Frequency / MHz H2SAgI H2SICF3 109 H2S 109 107 AgI L AgI AgI 107 H2S AgI L .
1000 800 600 400 200 0 -80 -60 -40 -20 0 20 40 60 80 39.1º V(φ)/cm-1 3 2 1 V = 0 φ/deg “Identification and molecular geometry of a weakly bound dimer (H2O,HCl) in the gas phase by rotational spectroscopy” A. C. Legon and L. C. Willoughby, Chem. Phys. Letters, 95, 449-52, (1983).
Nuclear Quadrupole Coupling Constants • Determination of the molecular geometry of each of the above complexes completed (where possible from isotopic substitution). • Nuclear quadrupole coupling constants provide measure of charge redistribution after formation of the complex.
Theory Dr. David Tew, University of Bristol • CCSD(T) calculations. • cc-pVTZ basis sets for H, O. • cc-pV(T+d)Z basis set for Cl. • cc-pVTZ-PP for Ag.
Publications on BMX Complexes H3N...AgCl, V.A. Mikhailov et al., Chem. Phys. Lett. 499, 16-20 (2010) H2O...CuCl and H2O...AgCl; V.A. Mikhailov et al., J. Chem. Phys., 134, 134305 (2011) H2O...AgF, S.L. Stephens et al., J. Mol. Spectrosc. 267, 163-168 (2011) H2S...CuCl and H2S...AgCl;N.R. Walker et al., J. Chem. Phys. 135, 014307 (2011) C2H4...Ag-Cl; S.L. Stephens et al., J. Chem. Phys. 135, 024315 (2011) Endo and co-workers


![Inclusion of metal-organic complexes into cucurbit[8]uril](https://cdn2.slideserve.com/4492514/slide1-dt.jpg)