Download
1 / 28
280 likes | 391 Views
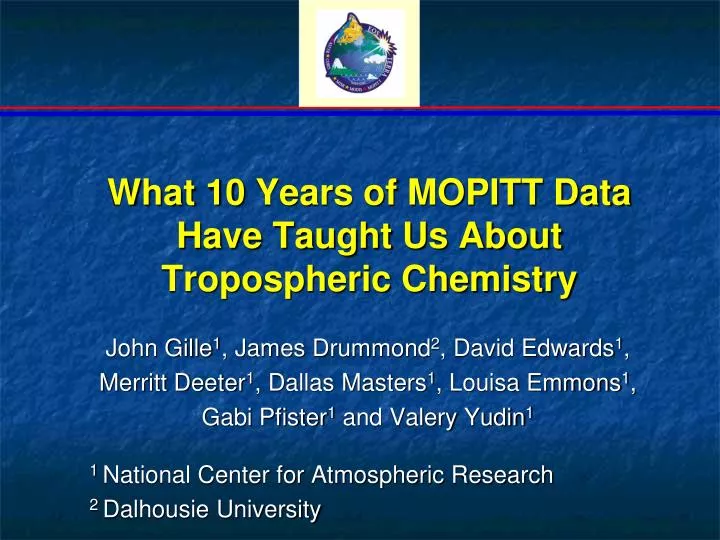
What 10 Years of MOPITT Data Have Taught Us About Tropospheric Chemistry. John Gille 1 , James Drummond 2 , David Edwards 1 , Merritt Deeter 1 , Dallas Masters 1 , Louisa Emmons 1 , Gabi Pfister 1 and Valery Yudin 1 1 National Center for Atmospheric Research 2 Dalhousie University.

E N D
What 10 Years of MOPITT Data Have Taught Us About Tropospheric Chemistry John Gille1, James Drummond2, David Edwards1, Merritt Deeter1, Dallas Masters1, Louisa Emmons1, Gabi Pfister1 and Valery Yudin1 1 National Center for Atmospheric Research 2 Dalhousie University
MOPITT Measurements of Atmospheric Carbon Monoxide • MOPITT = Measurements Of Pollution In The Troposphere • Carbon monoxide (CO) results from incomplete combustion, natural and anthropogenic, as well as the oxidation of CH4 and some other organic compounds • It is present in the atmosphere from mixing ratios of ~ 60 ppbv (S. Hemisphere) to ≥ 200 ppbv in polluted regions of the N. Hemisphere. Rough global average ~ 125 ppbv at surface • Dominant sources are in the troposphere • (Mesospheric and thermospheric photolysis of CO2 not considered here) • It is important as a sink of tropospheric OH, precursor to O3 formation, and tracer of its transport as well as that of other pollutant gases • Prior to MOPITT Launch, only global data were 4 short periods of measurements by the MAPS instrument on the space shuttle
CO Through the Year Total Columns in 1018 mol/cm2 April 2009 January 2009 July 2009 October 2008
Sensitivity of Tropical CO to ENSO • Low precipitation is associated with a higher fire count and high CO over the Maritime Continent. • While S. America and S. Africa are larger sources of CO, the Maritime continent is Responsible for the majority of the inter-annual variations. • The large inter-annual varia- tions show the value of the long data record. MOPITT 700 hPa CO ENSO Precipitation Index EENSO
CO and Fires Biomass burning is a major source of CO in the tropics and Southern Hemisphere. Here MODIS and MOPITT data for 23-30 September 2003 illustrate the close spatial correspondence between fires, CO (especially low altitude) and fine aerosol products. CO from fires in S. America and Africa combine to fill the S. Atlantic, and cross the Indian Ocean. (Edwards et al. JGR 2006a) MODIS Fire Counts MOPITT CO 250 hPa MOPITT CO 700 hPa MODIS Fine Mode Aerosol Optical Depth
Boreal Fires MOPITT data have helped To quantify the contributions Of boreal fires to the global CO budgets. Pfister et al. (JGR, 2005) used MOPITT data with the MOZART model to estimate the emissions from the 2001 Alaskan wildfires at 30±5 Tg CO, comparable to the anthropogenic emissions for the continental U.S. for the same time period.
Annual and Interannual Variability CO at 700 hPa from 10°N to 65° S as a function of time. There is a clear annual cycle, as well as a large inter- annual variation centered on 20°S. The source of the inter-annual variation is seen to be sources due to biomass burning in Indonesia and Australia. (Edwards et al., JGR 2006b)
Evidence for Long-Range Transport The top panel map shows high column amounts of CO coming from S. America and Africa in northern autumn, being advected across the Indian Ocean, Australia, New Zealand and beyond. The arrival of this plume over Lauder N.Z. is clearly shown in the FTIR data. MOPITT CO Total Column 1-9 Oct. 2003 Ground-based FTIR & MOPITT Total Column Measurements (Edwards et al., JGR 2006a)
Inversion to Obtain Source Locations and Strengths A recent development is the use of adjoints of CTM’s to obtain much more highly spatially resolved determinations of sources. The results shown here are correction factors to a priori Asian CO sources, calculated by large regions, and by use of the adjoint, on 2°x2.5° continental grid squares. (Kopacz et al, JGR 2009)
Beijing Shanghai Chengdu Wuhan Hong Kong A NEW CAPABILITY - Combing MOPITT TIR And NIR Channels Surface CO based on NIR + TIR Surface CO based on TIR only Recent work has made great progress in dealing with the channels measuring reflected solar radiation at 2.3 mm. These give much more sensitivity to surface concentrations, and allow easier direct determination of surface sources, bypassing concerns about boundary layer venting to the free troposphere. This can also be used to help estimate CO2 source strengths. See H. Worden et al., Poster U33B-0059, (Wednesday Afternoon)
What We Have Learned from MOPITT MOPITT retrievals show the large range of tropospheric CO mixing ratios, including spatial, annual and inter-annual variations. With a lifetime of several weeks, CO (and gases from similar sources with long lifetimes, e.g. C2H6) can be transported very long distances, and affect air quality far from its sources. MOPITT data can be assimilated in Chemical Transport Models and inverted to yield “top down” source locations and strengths, which have frequently been shown to be more accurate than “bottoms up” estimates. CO is a precursor to the production of tropospheric ozone, important in Earth’s radiative balance, thus it also affects climate. No one instrument can answer all questions. MOPITT data have been used productively with data from other instruments, and with models, (but account must be taken of the Averaging Kernels). GOING FORWARD, MOPITT’s high sensitivity to surface CO from simultaneous NIR and TIR signals promises to open new areas of research, including possibly estimating CO2 sources.
Spring-timeTrans-Pacific Transport MOPITT data have allowed more detailed studies of the transports of CO, particulates and other pollutants from S.E. Asia in northern spring. Many of these emissions are lifted from the surface into the mid-troposphere by advancing fronts. Not all reach North America. (Heald et al., JGR 2006)
Spring-time Trans-Pacific Transport is Episodic CO averaged from 20°-40°N at 500 hPa, showing the movement of alternating periods of high and low CO transported from E. Asia (~ 120°E) to the west coast of N. America (~ 240° E.) Transit time is ~5-7 days. The origin is the periodic lifting by frontal passage in Asia, followed by transport with traveling highs and lows of meteorological waves. (Gille and Lyjak, in preparation)
Partitioning Variability between Sources and Transport Deviation from mean in total CO burden over Pacific and U.S. Range bars on abscissa include source and meteorological variability; Range bars or ordinate show meteorological variability with constant source, based on MOZART-4 and MOPITT data Over Pacific, ½ of variability is due to meteorology, rest due to sources; over U.S. 2/3 of variability is due to meteorology. Pfister et al., ACPD 2009
Insight into the S. Atlantic Ozone Anomaly TOMS Tropospheric O3 column, January 1-27 2001 MOPITT CO @ 700 hPa, 20-27 Jan. 2001 MOPITT CO x-section, 10°-14° E. Flow schematic (Edwards et al., JGR 2003)
Combined retrieval for MOPITT Thermal IR + Near IR (solar reflectance) channels Comparison with MOZAIC data for Delhi, 9/3/2004 TIR only NIR only TIR + NIR Pressure (hPa) Pressure (hPa)
Sedimentation of Aerosols from the Plume Although the aerosols and CO have common sources, the aerosols sediment out of the plumes, reducing the ratio of the enhanced AOD to the CO column with time. These data are for biomass burning plumes exiting southern Africa over the Indian ocean between 15°- 40°S for the period 1-9 October 2003. (Edwards et al., JGR 2006a)
Partitioning Variability between Sources and Transport U.S. Pacific Correlation (r2) between absolute deviation from mean in total CO burden and different CO contributions over Pacific and U.S. Open bars include source variability, filled bars show constant source, based on MOPITT data and MOZART-4. Over Pacific, ½ of variability due to meteorology, rest due to sources; over U.S. 2/3 of variability due to meteorology. Pfister et al., ACPD 2009
Modeling MOPITT Observations MOPITT total column CO, 4-15 Nov. 2004 average CO columns from GEOS- Chem, emulating MOPITT observations It became apparent early on that modeling of MOPITT measurements was not possible without accurate information on the sources, which vary with time and location. The type of differences are illustrated here. These differences can be used with models and an inversion algorithm to estimate the location and intensity of sources. (Jones et al., ACP 2009)
Sensitivity of Tropical CO to ENSO a. ENSO precipitation index b. MODIS normalized fire count c. MOPITT 700 hPa CO mixing ratio (ppbv) for individual SH regions. Low precipitation is associated with a higher fire count and high CO over the Maritime Continent. While S. America and S. Africa are larger sources of CO, the Maritime continent is responsible for the majority of the inter-annual variations.
What We Have Learned from MOPITT Biomass burning sources of CO are very variable from year to year, with sensitivity to climate; As CO can lead to the production of tropospheric ozone, important in Earth’s radiative balance, it also affects climate; Bottom’s up estimates of CO source strengths have frequently been shown by comparison to MOPITT data to be underestimates; MOPITT data can be assimilated in Chemical Transport Models and inverted to yield source locations and strengths With a lifetime of several weeks, CO (and related gases with long lifetimes, e.g. C2H6) can be transported very long distances, and affect air quality far from its sources No one instrument can answer all questions. MOPITT data have been used productively with data from other instruments, and with models. The use of reflected NIR and emitted TIR radiation will give additional sensitivity to surface CO.
Methodological Lessons from MOPITT The use of Maximum a-Posteriori Likelihood is now much more widely employed and understood, including the use of Averaging Kernels and Degrees of Freedom of the Signal, by data users; Because of the low vertical resolution of the data, it is usually desirable to use them in conjunction with models. Assimilation, if done with proper care treatment of the different vertical scales in the models and the data, will provide the most complete information from the data.
Combining NIR) with TIR Channels Increases Sensitivity to Surface CO (Comparison with MOZAIC data for Delhi, 9/3/2004) NIR only TIR only TIR + NIR Pressure (hPa) Averaging Kernels Retrievals Pressure (hPa)