Download
1 / 29
290 likes | 344 Views
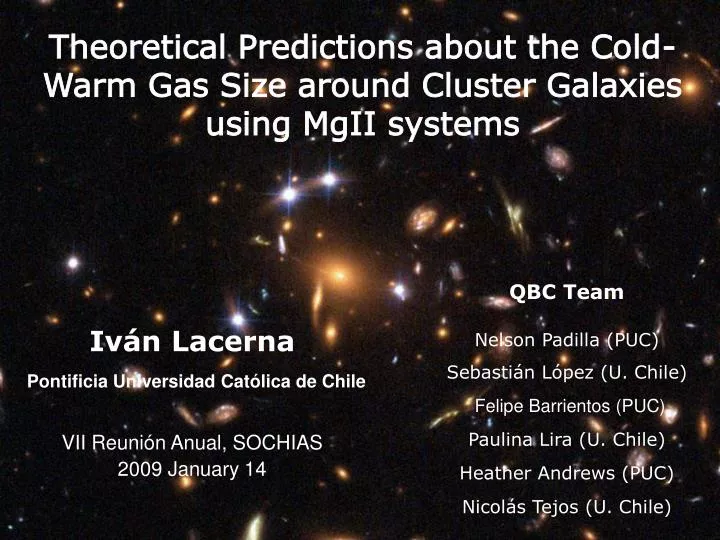
Theoretical Predictions about the Cold-Warm Gas Size around Cluster Galaxies using MgII systems. QBC Team Nelson Padilla (PUC) Sebastián López (U. Chile) Felipe Barrientos (PUC) Paulina Lira (U. Chile) Heather Andrews (PUC) Nicolás Tejos (U. Chile). Iván Lacerna.

E N D
Theoretical Predictions about the Cold-Warm Gas Size around Cluster Galaxies using MgII systems QBC Team Nelson Padilla (PUC) Sebastián López (U. Chile)Felipe Barrientos (PUC)Paulina Lira (U. Chile)Heather Andrews (PUC)Nicolás Tejos (U. Chile) Iván Lacerna Pontificia Universidad Católica de Chile VII Reunión Anual, SOCHIAS 2009 January 14
Introduction The Data GALFORM Semi-analytic Model Results for different distances to the cluster center. MgII absorption line strengths. Conclusions Cluster environment on galaxies is extremely important and can produce a decrement to a 90% of the halo size with respect to galaxies in the field. Outline
Introduction • Cluster galaxies have different properties than field galaxies. • Galaxy clusters have extreme environments (hostile) compared to the field • Galaxy transformations in clusters are constantly present. • López et al. 2008 (L08): • First optical survey of absorption systems associated with galaxy clusters at z = 0.3 – 0.9. • Background quasars having foreground clusters in the line-of-sight are used. • In order to do a comparison of galaxy properties in these clusters and those in the field via MgII absorption.
Absorption systems of doblet MgII ll2796, 2803 Åare sensitive tracers of galaxy haloes. • Related to cold-warm gas (T ~ 104 K).
They found a significantly overabundance of equivalent width W02796 > 2.0 Å compared with field population. • cluster environment could be pruning the baryonic halo size significantly. • This work: theoretical study of MgII absorption systems. • Aim: to determine how the size of the cold-warm baryonic halo around galaxies depends on environment • through statistical estimations. • By establishing the required cold-warm halo size needed to reproduce the observed MgII absorber statistics in: • clusters of galaxies. • the field.
The Data It is used the data ofLopez et al. (2008) Which include Red-Sequence Cluster Survey (RCS) clusters in the line-of-sight to background quasars.
Observed distribution of hits (fobs) • Nhits(b): number of observed hits per impact parameter. It is corrected by the field and clustering. • Nobs_cl : total number of observed clusters (212 clusters). • Nhits(b) corrected for systematic effects in the Cluster- QSO pair information: • Ncorr includes field and clustering correction.
In order to appreciate clear differences within the cluster environment, four ranges of b are selected. So, sample S:WS W02796 0.015 Å Nhits(b) after all corrections sample S:St W02796 1 Å
In order to establish the required cold-warm halo size needed to reproduce the observed MgII absorber statistics It is used the GALFORM semi-analytic model Which follows the evolution of galaxies in a LCDM Universe. data from Bower et al. (2006) version. Composite cluster of galaxies from the simulation: All selected clusters are grouped in only one. Selection of clusters: The closest redshift to L08 cluster sample, < z > ~ 0.7 Same median mass of RCS clusters, <M> = 1.64 x 10¹⁴h71-1M Galaxies with B/T 0.7 are considered. B/T: bulge to total light (stellar mass) ratio. It is assumed the presence of MgII absorptions mainly in spiralsystems (Zibetti et al., 2007). GALFORM Semi-analytic Model Composite Cluster distribution
Simulating different lines-of-sight: Impact parameters, b From 0 out to 2 h71-1 Mpc. Bins of 0.1 h71-1 Mpc. For each impact parameter, 25 angles are randomly chosen. “Hits” are counted, in function of b, as follows: • N(b): number of hits per impact parameter. • Nangles : number of random angles (25 angles). • Nclusters : number of clusters used from simulation (1608 clusters).
n(b) vs. Impact Parameter • All impacts out to 300 h71-1kpc from center of each galaxy are considered.
Finally, the relation between distribution of simulated hits and those by observations is n(b) = fobs(b) Hits are considered within a distance A x rdiskfrom center of each galaxy. The constant A is varied to match the observational studies. Then, it is assumed that MgII halo sizes in galaxies is directly proportional to their disk scale-lenghts (rdisk, given by the simulation) Distribution of MgII follows that of the baryonic matter in the disk. rMgII rdisk LOS
Galaxy disk scale-lengths and MgII galaxy haloes needed to reproduce the number of hits in the observations S:WS S:WS Peaks: rMgII ~ 4 h71-1kpc rMgII ~ 10 h71-1 kpc
Median sizes of MgII haloes as a function of projected distance to the cluster center • MgII galaxy haloes have smaller sizes near the cluster center. Result in accordance with : Strong interactions strip galaxies of their outer disks in cluster environments.
Comparing with field galaxies: Well in agreement with the observational estimate of Churchill et al. (1999). Cluster environment can produce a decrement to a 90% of the halo size with respect to galaxies in the field. peak: rMgII ~ 50 h71-1kpc
Not clear results for high equivalent widths. For low equivalent widths: Mild indication they tend to occur at larger distances from the galaxy center, at larger impact parameter. in good agreement with the stripping scenario, again. Where the low density MgII clouds (low W0) within a given galaxy would be more easily removed than the denser MgII regions nearer the galaxy center (high W0). It is assumed that stronger lines are produced nearer the centers of galaxies (Tinker & Chen, 2008).
Conclusions • Theoretical study of MgII halo sizes in galaxies in clusters • by comparing recent observational results (L08) to a semi-analytic model. • Results show: • Increase in the MgII halo sizes as the distance to the composite cluster increases. • Low equivalent width systems would tend to occur at larger distances from the galaxy center when distance to the cluster center increases. • both results are in agreement with the stripping scenario. • Cluster environment on galaxies is extremely important and can produce a decrement to a 90% of the halo size • with respect to galaxies in the field.
Now, in this current work: • It is defined new subsamples • In order to account for the different completeness limits with respect to the MgII equivalent width strengths. • sample S:WS Weak and Strong systems • Includes all QSO-Cluster pairs from the high resolution spectra • W02796 0.015 Å • sample S:St Strong systems only • W02796 1 Å
Number of hits Some absorbers are associated to two or more clusters. It was chosen the cluster with the nearest observed impact parameter, as first case. sample S:WS sample S:St
Field correction • MgII absorption is associated to a cluster only if the redshift distance is within cluster photometric redshift error (Dz). • Some hits could be in the field rather in clusters. • Also, clusters occupy biased density peaks in the distribution of matter • Characterized by a high amplitude cluster-mass cross-correlation function. • Clustering in the region surrounding the clusters. • Which would increase the ocurrence of MgII absorbers from the field in the few Mpc around each cluster.
dN/dz is obtained from studies of absorbers in the field. • For sample S:WS (W02796 0.015 Å) W0 = 0.3 Å 0.015 ≤ W0 < 0.3 Å Churchill et al. (1999) Nestor et al. (2005), W ≥ 0.3 Å • For sample S:St (W02796 1 Å) W0 = 1 Å
Cluster-mass cross-correlation function • rcm: comoving distance. • rfg : mean radius of field galaxies. • Yc : comoving distance in the redshift path. • r90: radius which contains 90% of galaxies within the cluster. b r90 Yc LOS where Bias factor of haloes, b = 1.6(Sheth, Mo, & Tormen 1998). Correlation function
known from observations • SNobs(b,W): total number of observed hits per range of b per range of W. • Nobs(b): total number of observed hits per range of b. • N(b): total number of hits per range of impact parameter. • SN(b,d): total number of hits per range of impact parameter • out to a maximum distance from galaxy center (d) given by the A parameter found previously. from simulation
Selection of clusters: • <M> = 1.64 x 10¹⁴h71-1M • Chosen to be the same median mass of RCS clusters. • It is calculated by using the BgcR parameter (cluster-center galaxy correlation amplitud, Gilbank et al., 2007). • Only in cluster-quasar pairs with error in BgcR less or equal 2s. • 212 observed clusters (Nobs_cl)
Finally, the relation between distribution of simulated hits and those by observations is n(b) = fobs(b) Hits are considered within a distance A x rdiskfrom center of each galaxy. The constant A is varied to match the observational studies. Then, it is assumed that MgII halo sizes in galaxies is directly proportional to their disk scale-lenghts (given by the simulation) Distribution of MgII follows that of the baryonic matter in the disk. For instance: bi = 1.1 Mpc and bf = 1.5 Mpc.
S:St S:St Peaks: rMgII ~ 1.5 h71-1kpc rMgII ~ 18 h71-1 kpc
How to implement these previous results in the context of different populations of equivalent width? Observed fractions of different line-strengths, fobs(b,W0) Finding the galacto-centric distance out to which the same fractions of model galaxies are included, n(b,d). Such a distance is then identified as the maximum distance out to which a given line-strength would be produced in the model. MgII absorption line-strengths • fobs(b,W0) = n(b,d)