Download
1 / 16
160 likes | 347 Views
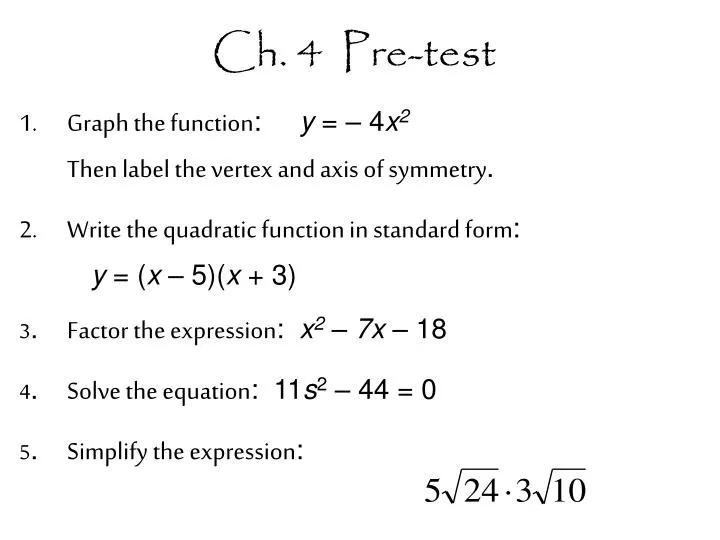
Ch. 4 Pre-test. Graph the function : y = – 4 x 2 Then label the vertex and axis of symmetry . Write the quadratic function in standard form : y = ( x – 5)( x + 3) 3 . Factor the expression : x 2 – 7x – 18 4 . Solve the equation : 11 s 2 – 44 = 0

E N D
Ch. 4 Pre-test Graph the function: y = – 4x2 Then label the vertex and axis of symmetry. Write the quadratic function in standard form: y = (x – 5)(x + 3) 3. Factor the expression: x2 – 7x – 18 4. Solve the equation: 11s2 – 44 = 0 5. Simplify the expression:
4.1 Graph Quadratic Functions in Standard Form Key Vocabulary: • standard form of a quadratic function: y = ax2 + bx +cwherea ≠0. • The graph is a parabola. • The lowest or highest point is the vertex: (x, y) • The axis of symmetry divides the parabola in symmetric halves.
Grapha quadratic function: y = ax2 + bx +c 1. Identify a, b,c constants. 3. Plot the points on the graph. 2. Make a Table: 4. Draw a smooth curve through the points. Forms a parabola. • Identify the axis of symmetry. • Identify the vertex.
Key Concept Sdf asdf Sadf Asdf asdf The axis of symmetry on the parent graph is x = 0. The vertex is (0 , 0). The Vertex sdf Sa asd The parent function is y = x2.
Graphy = ax2 + bx +c. 1. Identify a, b,c constants. 3. Plot the points on the graph. 2. Make a Table: 4. Draw a smooth curve through the points. Forms a parabola. • Identify the axis of symmetry. • Identify the vertex.
x2 + 3 12 EXAMPLE 1 Graphy = 2x2. Compare the graph with y = x2. Compare the two graphs: Notice that both graphs have the sameaxis of symmetry (x = 0) and the samevertex at (0,0). Graph y = – . Compare with the graph of y = x2. Notice that both graphs have the sameaxis of symmetryx = 0. But differentvertex points. One at (0, 0) and the other at (0, 3).
Graphy = ax2 + bx +c. 1. Identify a, b,c constants. 3. Plot the points on the graph. 2. Make a Table: 4. Draw a smooth curve through the points. Forms a parabola. • Identify the axis of symmetry. • Identify the vertex.
GUIDED PRACTICE Graph the function. Compare the graph with the graph of y =x2. 2. y = –x2 – 5 1. y = –4x2 Compared with y = x2 Same axis of symmetry and vertex, opens down, and is narrower. Same axis of symmetry, vertex is shifted down 5 units, and opens down.
So far, no b term (b =0) . . . now we add the b term: Properties of the graph of y = ax2 + bx + c • Characteristics of the graph of y = ax2 + bx + c: • The graph opens up if a > 0 (a is a positive #) and opens down if a < 0 (ais a negative #). • The vertex has x-coordinate x = . Substitute to find y-coordinate. • The axis of symmetry is x = . • The y-intercept is c, so the point ( 0 , c) is on the parabola. Asdf’
Graphy = ax2 + bx +c. 1. Identify a, b,c constants. 2. Find the vertex: x= Substitute x into function for y-coordinate. Form for vertex point: (x, y) 3. Identify the axis of symmetry: x-coordinate of vertex. 4. Graph the vertex point and axis of symmetry. 5. Make a table. (Use points on both sides of vertex.) 6. Graph the points from the table and connect the points with a smooth curve forming a parabola.
(– 8) 2(2) – – x = = 2 = b 2a EXAMPLE 3 Graph y = 2x2 – 8x + 6. Label the vertex and axis of symmetry. a = 2 b = -8 c = 6 2 > 0 so parabola opens up 3. Make a table: 1. Find the vertex: Now find the y- coordinate of the vertex: y = 2(2)2– 8(2) + 6 = – 2 4. Graph: So, the vertex is (2, – 2). 2. The axis of symmetry is:x = 2.
Graphy = ax2 + bx +c. 1. Identify a, b,c constants. 2. Find the vertex: x= Substitute x into function for y-coordinate. Form for vertex point: (x, y) 3. Identify the axis of symmetry: x-coordinate of vertex. 4. Graph the vertex point and axis of symmetry. 5. Make a table. (Use points on both sides of vertex.) 6. Graph the points from the table and connect the points with a smooth curve forming a parabola.
GUIDED PRACTICE Graph the function. Label the vertex and axis of symmetry. 4. y = x2 – 2x – 1 The vertex is (1, – 2). The axis of symmetry x = 1.
Key Concept Minimum and Maximum Values Lindsey Anderson
x= – b 2a To find the minimum or maximum value of a quadratic function: • Is a > 0 or is a < 0. (i.e. is a negative or positive?) a is negative – maximum a is positive – minimum • Find the vertex: (substitute for y) • The max. or min. value is the y-coordinate of the vertex.
(– 18) 2(3) x = – = – b 2a The minimum value is y = –7 at the point (3 , -7). EXAMPLE 4 Tell whether the function y = 3x2 – 18x + 20 has a minimum value or a maximum value. Then find the minimum or maximum value. a = 3b = -18c = 20 a > 0 (a is positive), so the function has a minimum value. Find the vertex: = 3 y = 3(3)2– 18(3) + 20 = –7 Homework 4.1: p. 240: 3-52 (EOP)