Download
1 / 18
180 likes | 284 Views
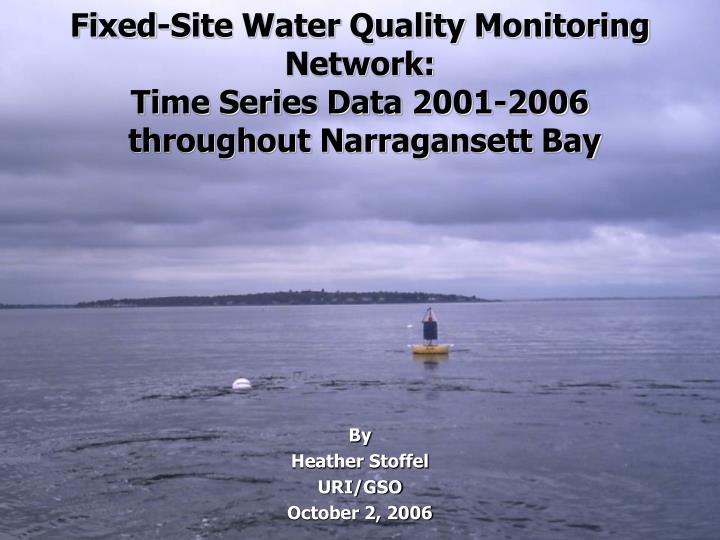
Fixed-Site Water Quality Monitoring Network: Time Series Data 2001-2006 throughout Narragansett Bay. By Heather Stoffel URI/GSO October 2, 2006. What is Time-Series Data?. Continuous water quality monitoring of the physical conditions

E N D
Fixed-Site Water Quality Monitoring Network:Time Series Data 2001-2006 throughout Narragansett Bay By Heather Stoffel URI/GSO October 2, 2006
What is Time-Series Data? • Continuous water quality monitoring of the physical conditions • Parameters: temp, salinity, DO, pH, CHL, and turbidity • Other Supporting Data: weather, tidal & flow data
Why is it important to Coastal Managers? • Help to clarify goals • Help to define the extent of the hypoxia issue • Describe trends • Baseline data • Analyzing conditions • Provides information for water quality reports • Inventing, evaluating, and selecting alternatives • Monitoring program
Data Collection Temperature Salinity Dissolved Oxygen pH Chlorophyll Turbidity YSI 6600 EDS
Narragansett Bay Fixed-Site Water Quality Monitoring Network • Agencies:RIDEM-OWR, URI/GSO, NBNERR, NBC, NBNEP, & RWU • Site Locations:West Passage, East Passage, Providence River, Seekonk River, West Greenwich Bay, & Mt. Hope Bay • Monitoring Season:buoy stations (May-Oct) & land-based stations (year round) • Funding: NOAA Bay Window Program, EPA Clean Water Act (sections 319 & 106), & NOAA National Estuary Program
How Data is Distributed to Coastal Managers, Scientists, & Public • BART (RIDEM-OWR)-weekly public posting of bay conditions www.dem.ri.gov/bart Critical Stations: Bullock Reach, Conimicut Point, North Prudence, & Greenwich Bay Marina • URI/GSO-daily observations www.narrbay.org • NBC-instantaneous readings www.narrabay.com • NBNERR-support national SWMP www.nbnerr.org • RWU-downloadable data www.rwu.edu • NBNEP-additional surveys & graphics www.geo.brown.edu/georesearch/insomniacs/
Dissolved Oxygen Criteria For Surface Waters & Waters without a Pycnocline • Waters with a DO concentration above an instantaneous value of 4.8 mg/l shall be considered protective of Aquatic Life Uses. Greenwich Bay Marina Station: Surface DO in 2003
Dissolved Oxygen Criteria For Waters with a Pycnocline (Bottom Waters) • Waters with a DO concentration above an instantaneous value of 4.8 mg/l shall be considered protective of Aquatic Life Uses. When instantaneous DO values fall below 4.8 mg/l, the waters shall not be: • 1. Less than 2.9 mg/l for more than 24 consecutive hours during the recruitment season; nor • 2. Less than 1.4 mg/l for more than 1 hour more than twice during the recruitment season; nor • 3. Shall they exceed the cumulative DO exposure presented in Table 3.A.
Allowable Number of Days without Exceeding a 5% Reduction in Seasonal Larval Recruitment
Total Number of Days Below DO Criteria of 4.8 mg/L at the North Prudence Station * * • * = Incomplete Dataset • Note: Critical Recruitment Season is May 1-October 31
Total Number of Days Below DO Criteria of 2.9 mg/L at the North Prudence Station * * • * = Incomplete Dataset • Note: Critical Recruitment Season is May 1-October 31
Hypoxia Trivia for Narragansett Bay • Hypoxia Season: June 12-September 28 • Minimum Hypoxia Surface Temperature: 18.5 C • Minimum Hypoxia Bottom temperature: 15 C • River Flows were above the 10 year average: 2001, 2003, & 2006