Download
1 / 1
10 likes | 120 Views
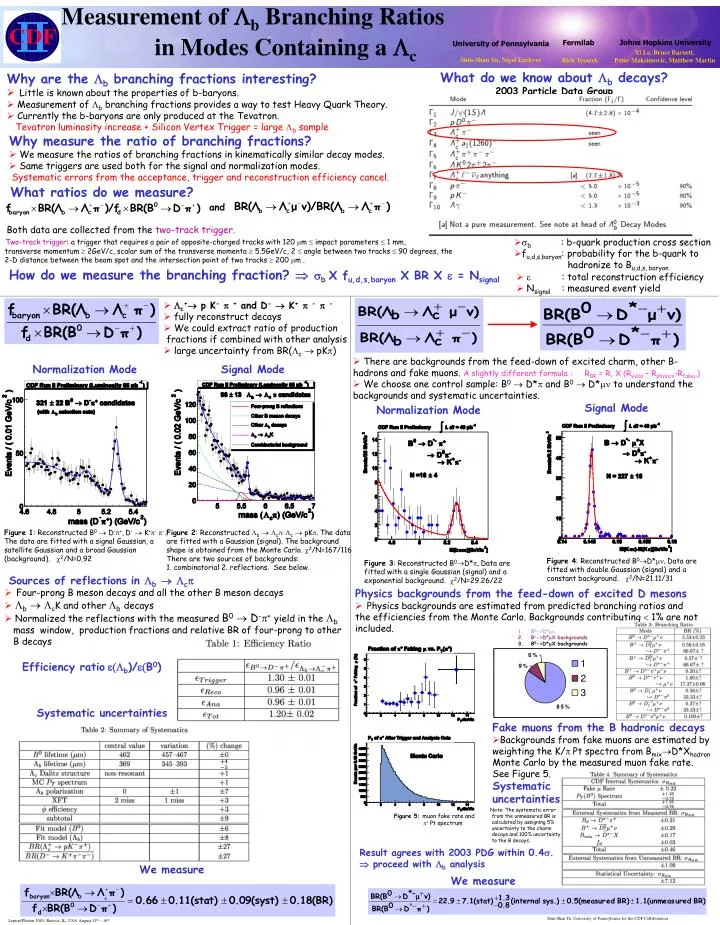
Measurement of b Branching Ratios in Modes Containing a c. Johns Hopkins University. Fermilab. University of Pennsylvania. Rick Tesarek. Yi Le, Bruce Barnett, Petar Maksimovic, Matthew Martin. Shin-Shan Yu, Nigel Lockyer. What do we know about b decays?

E N D
Measurement of b Branching Ratios in Modes Containing a c Johns Hopkins University Fermilab University of Pennsylvania Rick Tesarek Yi Le, Bruce Barnett, Petar Maksimovic, Matthew Martin Shin-Shan Yu, Nigel Lockyer What do we know about b decays? 2003 Particle Data Group • Why are the b branching fractions interesting? • Little is known about the properties of b-baryons. • Measurement of b branching fractions provides a way to test Heavy Quark Theory. • Currently the b-baryons are only produced at the Tevatron. Tevatron luminosity increase + Silicon Vertex Trigger = large b sample • Why measure the ratio of branching fractions? • We measure the ratios of branching fractions in kinematically similar decay modes. • Same triggers are used both for the signal and normalization modes. Systematic errors from the acceptance, trigger and reconstruction efficiency cancel. What ratios do we measure? and Both data are collected from the two-track trigger. Two-track trigger: a trigger that requires a pair of opposite-charged tracks with 120 mm impact parameters 1 mm, transverse momentum 2GeV/c, scalar sum of the transverse momenta 5.5GeV/c, 2 angle between two tracks 90 degrees, the 2-D distance between the beam spot and the intersection point of two tracks 200 mm . • sb : b-quark production cross section • fu,d,s,baryon: probability for the b-quark to hadronize to Bu,d,s, baryon How do we measure the branching fraction? b X fu,d,s,baryon X BR X e = Nsignal • : total reconstruction efficiency • Nsignal : measured event yield • c+ p K- + and D- K+ - - • fully reconstruct decays • We could extract ratio of production fractions if combined with other analysis • large uncertainty from BR(c pK) • There are backgrounds from the feed-down of excited charm, other B-hadrons and fake muons. A slightly different formula : RBR = Re X (Ryield – Rphysics-Rfakem) • We choose one control sample: B0 D* and B0 D*mn to understand the backgrounds and systematic uncertainties. Normalization Mode Signal Mode Signal Mode Normalization Mode Figure 1: Reconstructed B0 D-+,D- K+- -. The data are fitted with a signal Gaussian, a satellite Gaussian and a broad Gaussian (background). 2/N=0.92 Figure 2: Reconstructed b c, c pK.The data are fitted with a Gaussian (signal). The background shape is obtained from the Monte Carlo. 2/N=167/116 There are two sources of backgrounds: 1. combinatorial 2. reflections. See below. Figure 4: Reconstructed B0D*mn, Data are fitted with double Gaussian (signal) and a constant background. 2/N=21.11/31 Figure 3: Reconstructed B0D*p, Data are fitted with a single Gaussian (signal) and a exponential background. 2/N=29.26/22 • Sources of reflectionsin b c • Four-prong B meson decays and all the other B meson decays • b cK and other bdecays • Normalized the reflections with the measured B0 D-+yield in the b mass window, production fractions and relative BR of four-prong to other B decays • Physics backgrounds from the feed-down of excited D mesons • Physics backgrounds are estimated from predicted branching ratios and the efficiencies from the Monte Carlo. Backgrounds contributing 1% are not included. • B0->D*mn • B+->D*mX backgrounds • B0->D*mX backgrounds Efficiency ratio e(b)/e(B0) Systematic uncertainties • Fake muons from the B hadronic decays • Backgrounds from fake muons are estimated by weighting the K/p Pt spectra from BmixD*Xhadron Monte Carlo by the measured muon fake rate. See Figure 5. • Systematic • uncertainties Note: The systematic error from the unmeasured BR is calculated by assigning 5% uncertainty to the charm decays and 100% uncertainty to the B decays. Figure 5: muon fake rate and +Pt spectrum Result agrees with 2003 PDG within 0.4s. proceed with Lb analysis We measure We measure Lepton/Photon 2003, Batavia, IL, USA August 11th – 16th Shin-Shan Yu, University of Pennsylvania for the CDF Collaboration