Download
1 / 21
210 likes | 373 Views
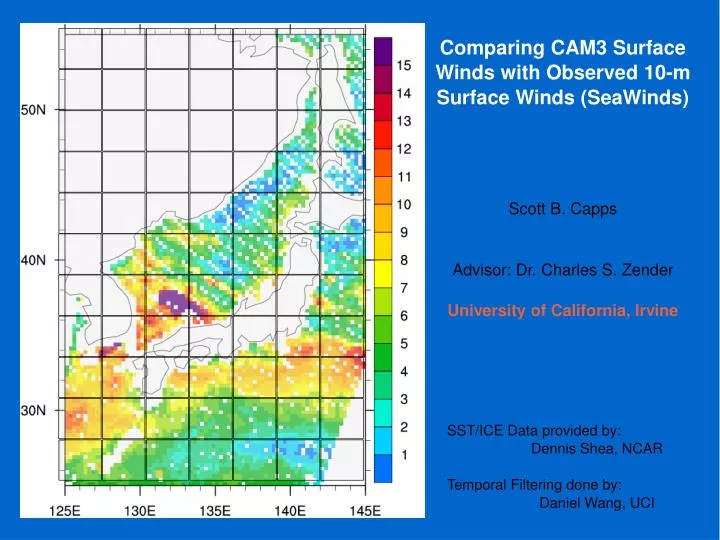
Comparing CAM3 Surface Winds with Observed 10-m Surface Winds (SeaWinds). Scott B. Capps Advisor: Dr. Charles S. Zender University of California, Irvine. SST/ICE Data provided by: Dennis Shea, NCAR Temporal Filtering done by: Daniel Wang, UCI. OUTLINE: CAM3 vs. SeaWinds Comparison

E N D
Comparing CAM3 Surface Winds with Observed 10-m Surface Winds (SeaWinds) Scott B. Capps Advisor: Dr. Charles S. Zender University of California, Irvine SST/ICE Data provided by: Dennis Shea, NCAR Temporal Filtering done by: Daniel Wang, UCI
OUTLINE: • CAM3 vs. SeaWinds Comparison • Implementation of 4-bin Wind Speed PDF • Physically-based Wind Speed PDF
QuikSCAT Surface Winds – 2005 A Shape=2.16 Scale=10.67 m s-1 A B A B B Shape=7.01 Scale=7.94 m s-1 A B
QuikSCAT Observations: • 1999 - Current • 10m surface wind speeds (m/s) • Empirically derived relationship between ocean roughness and wind speed • Asc/desc pass 6:00am/6:00pm QuikSCAT 10m Wind Speeds (m s-1) July 2, 2006 at 6pm local time QuikSCAT Grid Cell (0.25oX0.25o) T42 Grid Cell • Known Issues: • Rain cells discarded • Underestimates wind speeds > 25 m/s • Directional errors at low wind speeds • In situ vs. QuikSCAT RMS error differences <1 m/s and ~15o (Bourassa et al. 2003)
A Fair Comparison: CAM3 vs SeaWinds • QuikSCAT: • 2x/day x 365 days/year x 6 years = 4,380 • 0.25x0.25 degree resolution • 10-m winds (neutral stability) • CAM3.1.p2(uncoupled): • 72x/day x 365 days/year x 6 years = 157,680 • T42 resolution • DOM (observed SST/ICE for 2000-2005) • Lowest level winds (~50m AGL)
A Fair Comparison: CAM3 vs SeaWinds Sub-sample from CAM output • QuikSCAT: • 2x/day x 365 days/year x 6 years = 4,380 • 0.25x0.25 degree resolution • 10-m winds (neutral stability) • CAM(uncoupled): • 72x/day x 365 days/year x 6 years = 157,680 • T42 resolution • DOM (observed SST/ICE for 2000-2005) • Lowest level winds (~50m AGL) • QuikSCAT: • 2x/day x 365 days/year x 6 years = 4,380 • Spatial average of the temporal PDF • 10-m winds (neutral stability) • CAM: • 2x/day x 365 days/year x 6 years = 4,380 • Temporal PDF • DOM (observed SST/ICE for 2000-2005) • 10-m winds
2000-2005 SeaWinds Climatology and CAM3 Biases • 0.19 m/s global mean bias • Northern Hemisphere trade wind regions and mid-latitude storm tracks • 2.5-3.0 m/s positive bias in circumpolar region • 1.0-3.0 m/s negative bias in ITCZ
0.27 m/s global mean bias • Overestimates variability in the North Atlantic storm track • Equatorial periphery of subtropical anticyclones • Underestimates variability in Indian Ocean
-0.18 m/s global mean bias • 1.5 positive bias near Australia • Negative biases in the ITCZ
-0.12 m/s global mean bias • Underestimates peak winds in doldrums • Overestimates peak winds in trade wind regions • 5 m/s bias in south Indian Ocean
Zonally-Averaged Statistical Parameters • Mean wind speed and shape positive differences in NH trade wind regions • Largest positive mean speed and shape differences in NH/SH storm track regions
TOGA TAO Region CAM minus SeaWinds
The Forcing of a 4-bin Wind Speed PDF June 2000-2005 Climatology
The Implementation of a 4-bin Wind Speed PDF Slab Ocean Model 4-bin PDF minus 1-bin climatology (lowest level winds) A significant decrease in mean winds within the circumpolar and trade wind regions
Future Research: Implementing a Physically-based PDF Velocity Scales (Cakmur et al. 2004) Turbulence Kinetic Energy Dry (Free) Convection Turbulence Gust Fronts Richardson Number R. V. Cakmur and R. L. Miller; Incorporating the effect of small-scale circulations upon dust emission in an atmospheric general circulation model, Journal of Geophys. Research, 109; 2004
Future Research: Implementing a Physically-based PDF • TKE Diagnostic is not consistent with observations: • Observed TKE values (Stull(1988), Yamada & Mellor(1975)): • Convectively mixed: 3 m2/s2 (sfc-300m) • Neutral: 3.4 m2/s2 • Stable: < 0.4 m2/s2 Relative Frequency Need to Evaluate other PBL schemes
CONCLUSIONS: Consistent Positive Shape and Mean Wind Biases in Trade Wind and Circumpolar Regions 4-bin PDF Improved Positive Biases Physically-Based PDF: Need More Turbulence Parameters (Shallow Convection Scheme Downdraft Mass Flux)