Download
1 / 10
100 likes | 159 Views
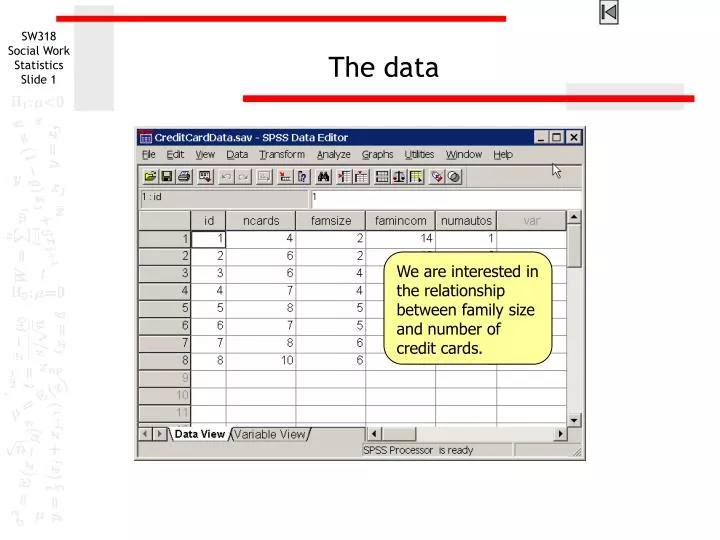
The data. We are interested in the relationship between family size and number of credit cards. The scatter diagram or scatterplot. The dependent variable is plotted on the Y or vertical axis. The independent variable is plotted on the x or horizontal axis. The mean as the best guess.

E N D
The data We are interested in the relationship between family size and number of credit cards.
The scatter diagram or scatterplot The dependent variable is plotted on the Y or vertical axis. The independent variable is plotted on the x or horizontal axis.
The mean as the best guess Without taking into account the independent variable, our best guess for the number of credit cards for any subject is the mean, 7.0.
Errors using the mean as estimate Errors are measured by computing the difference between the mean and each Y value, squaring the differences, and then summing them. When we compute the answer in SPSS, it will tell us that the total amount of error is 22.0.
Possible other lines that reduce error There are numerous other lines that we could draw that more closely fit the pattern of the data points.
The regression line The best line is the regression line which minimizes the error (the best fitting or least squares line)
The equation for the regression line SPSS will give us the formula for the regression line in the form Y = a + bX, or for these variables: Number of Credit Cards = 2.871 + .971 x Family Size
PRE reduction in error SPSS also tells us the amount of error using only the mean and using the regression line.
Pearson’s r correlation coefficient The square root of r2 is Pearson’s r, the correlation coefficient.