Download
1 / 33
330 likes | 512 Views
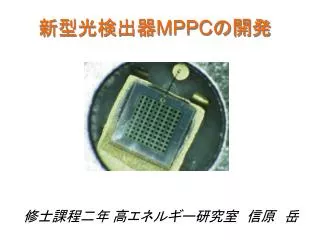
MPPC の性能評価. 2007.4.24 筑波大学 須藤 山崎. 基礎特性の評価 浜松ホトニクス訪問. 測定 sample ILC-11-025M (2006 年 10 月 , plastic package) S10362-11-025U (2006 年 12 月 , CAN package) これらの sample について、以下の性能を測定、比較した。. Gain Noise rate Cross-talk 光子検出効率 有感領域 ( レーザーを使用 ). ILC-11-025 2006.10. S10362-11-025U

E N D
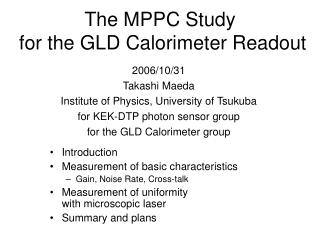
MPPCの性能評価 2007.4.24 筑波大学 須藤 山崎 • 基礎特性の評価 • 浜松ホトニクス訪問
測定sample • ILC-11-025M (2006年10月, plastic package) • S10362-11-025U (2006年12月, CAN package) • これらのsampleについて、以下の性能を測定、比較した。 • Gain • Noise rate • Cross-talk • 光子検出効率 • 有感領域 (レーザーを使用)
ILC-11-025 2006.10 S10362-11-025U 2006.12 d ・ 0.25 [pC] C ΔV Gain = Gain = e e AMP ・ Gain測定 (25℃) d • 新sample(2006.12)のC ( pixel capacitance )は旧sample(2006.10)の約80% • C200610 = 21.6 [ fF ] C200612 = 17.6 [ fF ] • 印加できる最大over-voltageが小さくなっている 新 ~4V 旧~5V( ΔV )
ILC-11-025 2006.10 ILC-11-025 2006.10 S10362-11-025U 2006.12 S10362-11-025U 2006.12 Noise rate , Cross talk スケーラーを用いて測定 Cross talk Noise rate [ Hz ] ΔV= Vbias – V0 ΔV= Vbias – V0 • Noise rate は新sample( 2006.12 )の方が • ~20kHz 大きい(ΔV < 3.5V) • Cross talk はΔV < 3Vの範囲で新・旧あまり変わらない
μMPPC μPMT PDE MPPC = PDEPMT MPPC Blue LED WLSF :λ~ 500 nm 0.5 mm 径 ピンホール PMT 光子検出効率 (PDE) ~1光子の入射に対してそれを検出する確率 MPPCの光子検出効率は、光電子増倍管との応答比から求めた. MPPC μ : MPPC・PMTそれぞれの 測定光電子数 PMT
PDE [ % ] ILC-11-025 2006.10 S10362-11-025U 2006.12 ΔV( = Vbias – V0) [ V ] PDE結果 • Gain = 3×10⁵で PDEは 14~15% • 新・旧同程度 • 使用できるΔVの範囲でPDEは飽和しない
YAG Laser, = 532 nm • Pulse width~2 nsec • Pulse rate ~ 8 kHz • Spot size ~ 1m • 光量 ~ 1 p.e. 以下 1600-pixel MPPC LASERを用いた測定@ KEK-DTP
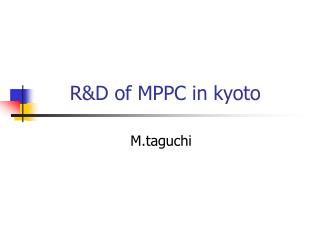
2005冬 ILC-11-025 ( 2006.10) S10362-11-025U ( 2006.12 ) 1600-pixel MPPC の顕微鏡写真 Can package Plastic package Can package • ピクセルの受光面の形が変化 している
有感領域 (2006.12 sample) 検出光電子数を用いて有感領域の割合を評価 S10362-11-025U (2006.12) 2005冬 • 検出光電子数が 50%MAX ≦ の領域を有感領域とすると • 有感領域は ~27%2005冬sample ( ~18% )の1.5倍
まとめ1 • 2006.10 と 2006.12 のsample について測定を行った • 新sampleはC ( pixel capacitance )が小さくなった C新 は C旧 の ~80% • 新sampleのNoise rate は少し大きくなった ΔV < 3.5V の領域で ~20kHz 上昇 • Cross talk はΔV < 3Vの範囲で新・旧あまり変わらない • PDEも新・旧同程度 ( 最大18% ) • 新sampleは有感領域が拡大されている 2005冬sampleと比べて約1.5倍
C PDE = Q.E. ×εGeom × εGeiger ΔV , Gain = e S C = ε d Si Resistor Bias voltage (70~80 V) p n + + p p - - substrate p substrate p + + 疑問・質問 • LASERを用いた測定結果から有感領域は大きくなっていることがわかったが、pixel capacitance が小さくなったのはなぜか? • また、PDEは有感領域の拡大によって向上すると考えていたが、旧サンプルと同程度なのはなぜか? • 印加できる最大over voltageが小さくなったのはなぜか? • 表面の構造の変化 • 内部構造 (各層の厚さ) • ドーピング濃度の変化 d
LASERを用いた測定結果から有感領域は大きくなっていることがわかったが、pixel capacitance が小さくなったのはなぜか? シリコンウェハーを厚くした影響 ウェハーの厚さは3 ~ 4 μm 2. PDEは有感領域の拡大によって向上すると 考え ていたが、旧sampleと同程度なのはなぜか? よくわからないらしい 新sample(2006.12)はHPK的にも妥当な値のようだ
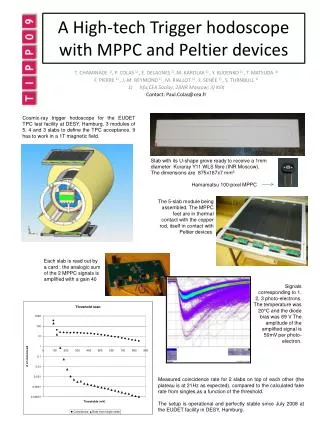
Light input (photoelectrons) The MPPC linearity • Most important fact for the calorimeter is linearity and dynamic range • ILC-cal uses 1600 pixel MPPCs • if this devise behaves ideally : • Nfired pixel = 1600 pixel expected response curve 1600 1600 (信州大 魚住さん)
Light input (arbitrary) linearity measurements 2 1600 pixels taken by charge ADC 100ns gate width 120ns MPPC signal PMT signal 1600 gate (信州大 魚住さん)
Linearity measurements 2 1600 pixels taken by peak height with oscilloscope Number of fired pixels light input (arbitrary) (信州大 魚住さん) saturation is observed (~1300 pixel), but it still does not follow the expectation curve.
pulse shape 100ns • DESY AHCAL group tested MPPCs. SiPM WLS fiber is used SiPM SiPM SiPM medium light intensity MPPC 400 high light intensity MPPC 1600 (信州大 魚住さん)
saturation measurement 100 ns integration 50 ns integration 30 ns integration • DESY AHCAL tested SiPM 1.2 MΩ SiPM 10.4 MΩ 1600 pix 400 pix MPPC 1600 MPPC 400 (信州大 魚住さん)
Calorimeter test module and Beam Test @ DESY MPPCs (1600 pixels) Tungsten (3.5 mm thick) Scintillator layer (3 mm thick) e+ Frame Scintillator strip (1 x 4.5 x 0.3 cm) WLS fiber (信州大 魚住さん)
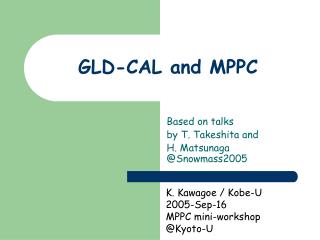
Observed linearity of the calorimeter data at desy without correction Simulation 13% e+ beam energy (GeV) • MPPCのsaturation effectに対して何の補正もして • いないにも関わらず、カロリメータの応答はほぼ線形。 (信州大 魚住さん)
まとめ2 • シリコンウェハーの厚さは 3 ~ 4 μm • 有感領域(開口率)は拡大 ( ~ 27% ) • 開発方針 pixel capacitance を大きくする方向 • ポリシリコン抵抗の抵抗値は 200 ~ 300 kΩ • pixel の回復時間が短い ~ 数 ns • 格子欠陥、ドリフト時間の差などにより遅い成分の信号がある • クロストークの原因になる • 光子の波長は ~ 1μm ( 吸収係数 ~1mm ) • 金属を pixel 間に入れることでクロストーク率を減少させる方向
MPPC LASER Recovery time setup
今後 • 光源の波長を変えてPDEの測定 • 新sampleの基礎特性の評価(温度依存性、LASER) • 応答曲線についての理解する • 長期安定性
光の広がり 広がりは0.55mm径
~ 1 mm 25 mm Depletion region ~ 1 mm Substrate Si Resistor Guard ring n+ Bias voltage (70~80 V) p n+ Al conductor p- substrate p+ Multi-Pixel Photon Counter (MPPC) ~ シリコン半導体光検出器
浜松ホトニクスによるP.D.Eの測定結果 浜松ホトニクスによるP.D.Eの測定結果 ※λ=400nm, including the cross-talk and after pulse
光子検出効率測定の Setup Φ0.5mm Blue LED
PMTの量子効率分布 ( HPKによる測定 ) WSLFの発光スペクトル • この二つの分布からWLSFに対するPMTのPDEを求めた。 PDE測定
~1光子の入射に対してそれを検出する確率 MPPCの光子検出効率は、光電子増倍管との応答比から求めた. μMPPC μPMT PDE MPPC = PDEPMT MPPC,PMT のPedestal のイベント数からPoisson分布関数を用いて検出光電子数を求めた。 MPPC MPPC μ : Poisson分布の平均値 Blue LED P0(μ) = e-μ = Npedestal / Nall μ= -ln( Npedestal / Nall ) WLSF :λ~ 500 nm 0.5 mm 径 ピンホール PMT PMT 光子検出効率 (PDE)