Download
1 / 26
260 likes | 376 Views
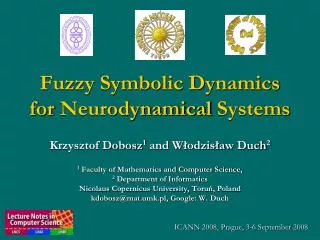
Attractors in Neurodynamical Systems. Włodzisław Duch, Krzysztof Dobosz Department of Informatics Nicolaus Copernicus University , Toruń, Poland Google: W. Duch ICNN , Hangzhou, Nov 200 9. Motivation.

E N D
Attractors in Neurodynamical Systems Włodzisław Duch, Krzysztof Dobosz Department of Informatics Nicolaus Copernicus University, Toruń, Poland Google: W. Duch ICNN, Hangzhou, Nov 2009
Motivation • Neural respiratory rhythm generator (RRG): hundreds of neurons, what is the system doing? • Analysis of multi-channel, non-stationary, time series data. • Information is in the trajectories, but how to see in high-D? • Component-based analysis: ICA, NNMF, wavelets ... • Time-frequency analysis, bumps ... • Recurrence plots, state portraits: limited info about trajectories. Fuzzy Symbolic Dynamics (FSD): visualize + understand. • Understand FSD mappings using simulated data. • First looks at some real data. • Examples from simulations of semantic word recognition.
Brain Spirography Example of a pathological signal analysis
Recurrent plots and trajectories Trajectory of dynamical system (neural activities, av. rates): Use time as indicator of minimal distance: For discretized time steps binary matrix Rij is obtained. Many measure of complexity and dynamical invariants may be derived from RP: generalized entropies, correlation dimensions, mutual information, redundancies, etc. N. Marwan et al, Phys. Reports 438 (2007) 237-329. Embedding of time series or mutidimensional trajectories.
Recurrence plots • Unfold the trajectory at t and show when it comes close to x(t).
Fuzzy Symbolic Dynamics (FSD) Trajectory of dynamical system (neural activities, av. rates): 1. Standardize data. 2. Find cluster centers (e.g. by k-means algorithm): m1, m2 ... 3. Use non-linear mapping to reduce dimensionality: Localized membership functions: sharp indicator functions => symbolic dynamics; strings. soft membership functions => fuzzy symbolic dynamics, dimensionality reduction => visualization.
Model, radial/linear sources Sources generate waves on a grid Flat wave Radial wave Relatively simple patterns arise, but slow sampling shows numerical artifacts. Ex: one and two radial waves.
Radial + plane waves Radial sources are turned on and off, 5 events+transients.
Respiratory Rhythm Generator 3 layers, spiking neurons, output layer with 50 neurons
FSD development • Optimization of parameters of membership functions to see more structure from the point of view of relevant task. • Learning: supervised clustering, projection pursuit based on quality of clusters => projection on interesting directions. • Measures to characterize dynamics: position and size of basins of attractors, transition probabilities, types of oscillations around each attractor (follow theory of recurrent plots for more). • Visualization in 3D and higher (lattice projections etc). • Tests on model data and on the real data.
BCI EEG example • Data from two electrodes, BCI IIIa
Alcoholics vs. controls Colors: from blue at the beginning of the sequence, to red at the end. Left: normal subject; right: alcoholic; task: two matched stimuli, 64 channels (3 after PP), 256 Hz sampling, 1 sec, 10 trials; single stalc.
Learning: mapping one of the 3 layers to the other two. Fluctuations around final configuration = attractors representing concepts. How to see properties of their basins, their relations? Model of reading Emergent neural simulator: Aisa, B., Mingus, B., and O'Reilly, R. The emergent neural modeling system. Neural Networks, 21, 1045-1212, 2008. 3-layer model of reading: orthography, phonology, semantics, or distribution of activity using 140 microfeatures of concepts. Hidden layers in between.
Attractors FSD representation of 140-dim. trajectories in 2 or 3 dimensions. Attractor landscape changes in time due to neuron accommodation.
2D attractors for words Dobosz K, Duch W, Fuzzy Symbolic Dynamics for Neurodynamical Systems. Neural Networks (in print, 2009). Same 8 words, more synaptic noise.
Depth of attractor basins Variance around the center of a cluster grows with synaptic noise; for narrow and deep attractors it will grow slowly, but for wide basins it will grow fast. Jumping out of the attractor basin reduces the variance due to inhibition of desynchronized neurons.
3D attractors for words Non-linear visualization of activity of the semantic layer with 140 units for the model of reading that includes phonological, orthographic and semantic layers + hidden layers. Cost /wage, hind/deer have semantic associations, attractors are close to each other, but without neuron accommodation attractor basins are tight and narrow, poor generalization expected. Training with more variance in phonological and written form of words may help to increase attractor basins and improve generalization.
Connectivity effects Same situation but recurrent connections within layers are stronger, fewer but larger attractors are reached, more time is spent in each attractor. With small synaptic noise (var=0.02) the network starts from reaching an attractor and moves to creates “chain of thoughts”.
Inhibition effects Prompting the system with single word and following noisy dynamics, not all attractors are real words. Increasing gi from 0.9 to 1.1 reduces the attractor basins and simplifies trajectories.
Exploration Like in molecular dynamics, long time is needed to explore various potential attractors – depending on priming (previous dynamics or context) and chance. Same parameters but different runs: each time a single word is presented and dynamics run exploring different attractors.
Neurons and dynamics Trajectories show spontaneous shifts of attention. • Attention shifts may be impaired due to the deep and narrow attractor basins that entrap dynamics – dysfunction of leak channels (~15 types)? In memory models overspecific memories are created (as in ASD), unusual attention to details, the inability to generalize visual and other stimuli. • Accommodation: voltage-dependent K+ channels (~40 types) do not decrease depolarization in a normal way, attractors do not shrink. This should slow down attention shifts and reduce jumps to unrelated thoughts or topics (in comparison to average person). Neural fatigue temporarily turns some attractors off, making all attractors that code significantly overlapping concepts inaccessible. This is truly dynamic picture: attractor landscape changes in time! What behavioral changes are expected depending on connectivity, inhibition, accommodation dynamics, leak currents, etc?
What can we learn? • Visualization should give insight into general behavior of neurodynamical systems, measure of complexity and dynamical invariants may be derived along the lines of recurrence plots. • How many attractors can be identified? • Where does the system spends most of its time? • Where is the trajectory most of the time? • What are the properties of basins of attractors (size, depths, time spend)? • What are the probabilities of transition between them (distances )? • How fast the transition occurs? • What type of oscillations occur around the attractors? Chaos? • FSD shows global mapping of the whole trajectory (do we want that?). • Different conditions more easily distinguished and interpreted than in recurrence plots, potentially useful in classification and diagnosis.
Future plans • Relations between FSD, symbolic dynamics, and recurrence plots. • Simulated EEG models to understand how to interpret the FSD plots. • Other visualization methods: MDS, LLE, Isomap, LTSA, diffusion map … • Effects of various component-based transformations: PCA, ICA, NNMF ... • Supervised learning of membership function parameters to find interesting structures in low-dimensional maps: adding projection pursuit to find interesting views; projection pursuit in space and time to identify interesting segments. • Combining projection pursuit with time-frequency analysis and FSD for EEG analysis. • Systematic investigation of parameters of neurodynamics on basins of attractors. • BCI and other applications + many other things …
Thank youfor lending your ears ... Google: W. Duch => Papers & presentationsSee also http:www.e-nns.org