Download
1 / 19
190 likes | 312 Views
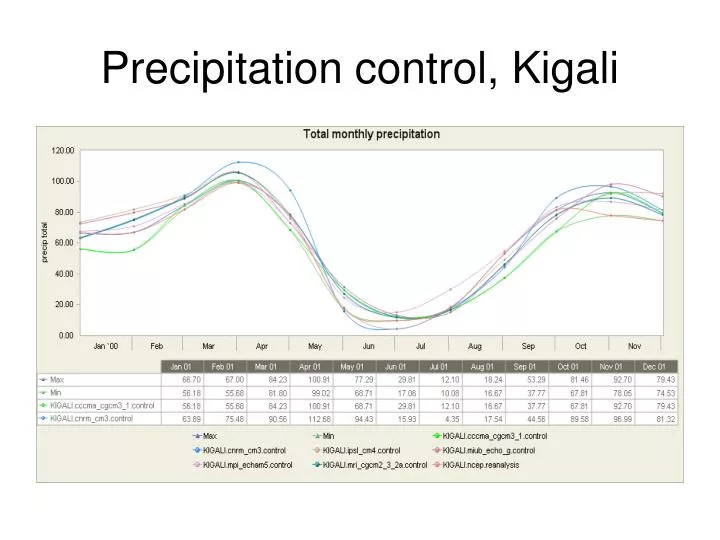
Precipitation control, Kigali. Minimum temperature anomaly, Kigali, Futurea. Futurea. Kigali, Futurea precipitation. Kigali, Futureb scenario. Maximum temperature anomaly, Kigali, Futureb. Futureb – actual precipitation, Kigali. Futureb. Kigali (latitude 1.59 S, long.30.05 E).

E N D
Kigali (latitude 1.59 S, long.30.05 E) In summary: Considerably warmer in both time slices (Average maximum monthly temperatures are expected to increase by 1.5-2.7oC for 2046-2065, and greatest warming is likely from July-Sep. For monthly minimum temperatures may rise by between 1.7 and 2.8oC for 2046-2065 from results from a set of 10 GCMS with the most warming occurring in June to August. For second time slice temperature increased by 5 to 10oC for monthly min and 6 to 10 oC for monthly max. Precip – also increased for both time slices and in every month of the year but more in the wet seasons centred around April and September. By around 2050s a suitable analogue might be central Rwanda, Luwero district,. West of lake Kyoga. Second rainy season is earlier than that in Kigali, however temperature and precipitation monthly rainfall patterns similar to the projection for Kigali for that time slice.
Nairobi summary Projections for 2046-2065 indicate future increases in temperature from 1.5 to 3oC with increases more consistent for minimum temperature. Increases are fairly consistent throughout the year – the highest being in July and August. Most scenarios also show increases in monthly precipitation except for two models which show small decreases between July and October and one showing a decrease in January. In general increases range from 0 to 50 mm per month, with increases in all months, the highest being in April. Quite wide spread. A possible future analgue for this time slice could be the Lake Victoria region of Tanzania which shows a very similar rainfall pattern throughout the year. Higher temperatures (around 2oC warmer) and higher precipitation (around 20mm per month) in the range of the Futurea scenarios than Nairobi at present. See following map.