Download
1 / 10
100 likes | 143 Views
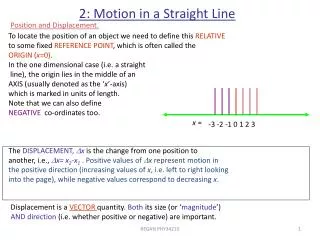
MOTION IN A STRAIGHT LINE GRAPHICALLY. Equations of motion. (Acceleration is constant). Distance-time graph. s (m). 0. 0. t (s). Velocity-time graph. v (ms -1 ). 0. 0. t (s). Example.

E N D
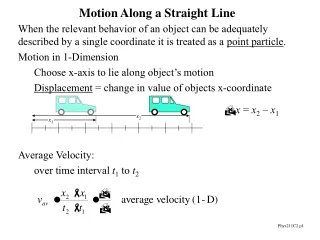
Equations of motion (Acceleration is constant)
Distance-time graph s (m) 0 0 t(s)
Velocity-time graph v (ms-1) 0 0 t(s)
Example A cyclist is travelling at a constant speed of 4ms-1. Sketch a graph of speed against time. What is the gradient of the graph? What does this represent? Use the graph to find the distance travelled between: t = 0 and t = 2, t = 2 and t = 5, t = 0 and t = T. Sketch the graph of distance travelled against time. What is the relationship between this graph and the speed of the cyclist?
Example The speed of a car increases at a constant rate from 0 to 15ms-1 is a 10 second interval. Sketch a graph to show the speed of the car against time. Find the gradient of the line and describe what information this gives about the motion of the car. Find the distance travelled by the car between: t = 0 and t = 5, t = 0 and t = T. Use this information to sketch a graph of distance against time. What is the relationship between the gradient of this graph and the speed of the car?
Example A particle is moving in a straight line with constant acceleration, which has a velocity of 2 ms-1 at one instant and 3 seconds later has a velocity 8 ms-1. Sketch a graph of speed against time.
Example A car is moving along a straight line. It is taken from rest to a velocity of 20ms-1 by a constant acceleration of 5ms-2. It maintains a constant velocity of 20ms-1 for 5 seconds and then is brought to rest again by a constant acceleration of -2ms-2. Sketch a velocity-time graph and find the distance covered by the car.
Example A particle is travelling in a straight line. It has velocity of 10ms-1 when it is subjected to an acceleration of -2ms-2 for 8 seconds. Sketch a velocity-time graph for this interval of eight seconds and find: a) the increase in displacement b) the distance covered for the interval of eight seconds.
SUMMARY The gradient of a distance-time graph gives the speed. The gradient of a velocity-time graph gives the acceleration. The area under a velocity-time graph gives the distance travelled.