Download
1 / 31
310 likes | 380 Views
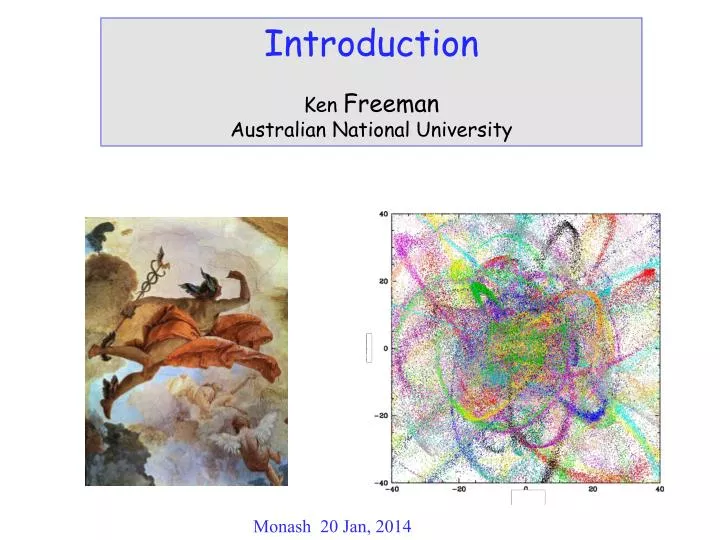
Introduction Ken Freeman Australian National University. Monash 20 Jan, 2014. The abundance of chemical elements in stars

E N D
Introduction Ken Freeman Australian National University Monash 20 Jan, 2014
The abundance of chemical elements in stars Stars form from the interstellar gas. The gas has been enriched in chemical elements by generations of star formation. The enrichment occurs through nucleosynthetic processes (Lattanzio) in relatively massive stars, each of which affects the abundances of different elements. These more massive stars have short lives and return chemically enriched gas to the ISM when they die. A generation of enrichment is 107 to 108 years, so the younger stars form from gas that has had ~ 1000 generations of enrichment. The oldest stars may have had only a few generations of enrichment. The chemical composition at the surface of a star reflects the composition of the gas from which it formed. Once a star has formed, although its interior composition evolves, its surface composition does not change significantly as the star ages (except for some of the elements lighter than Mg).
The light of a star contain much information about its chemical composition. From its spectrum, we can measure the abundance of 30 or more of the chemical elements at the surface of the star. The next slide shows the spectrum of the sun at resolving power / = 80,000 or about 4 km s -1. At 4000 Å (blue), this detail has a scale of 0.05 Å
High resolution spectrum (R ~ 80,000) 17Å blue light window on the Sun revealing detailed chemistry of Fe, Cr, Ti, V, Co, Mg, Mn, Nd, Cu, Ce, Sc, Gd, Zr, Dy
For common stars, the overall level of element abundances varies by about a factor of 100 from star to star: typical range is from about 3 times the solar abundance to about 0.03. The level depends on their chemical enrichment history: e.g. how many cycles of enrichment the gas suffered before this star was formed. Some stars have lower overall element abundances, down to < 10-5 times the solar value, but they are rare. Notation: use abundance of the common element Fe as a measure of the overall abundance relative to the sun: e.g. [Fe/H] = 0 is like the sun, [Fe/H] = -2 is 0.01 times the solar abundance. Then use [X/Fe] as measure of (abundance of element X relative to Fe) relative to the sun. e.g. [Mg/Fe] = 0.4 means that the star has about 2.5 times as much (Mg relative to Fe) as in the sun. From star to star, the variation of [X/Fe] is usually less than the variation of [Fe/H].
Stars are mostly born in clusters of 103 to 106 stars. In almost all star clusters, the chemical abundances of its stars are observed to be identical over almost all of the elements. The gas from which clusters form is very well homogenised. The abundances are different from cluster to cluster, depending on the gas from which they formed.
Most open star clusters do not live very long. After about 20 Myr, they lose mass as their stars age, and the clusters disrupt and are spread around the Galaxy. But the stars remember their chemical compositions as they disperse around the Galaxy. The stars of surviving open clusters have identical abundances at the level to which they can be measured (e.g. de Silva 2009). If we can find stars in the Galaxy with identical compositions over 25 or 30 elements, then they are probably part of the debris of one common disrupted star cluster. These debris stars are the fossil remnant of the disrupted cluster.
Formation of the star clusters is a major part of the assembly of the Galactic disk. This is all still poorly understood - most of our knowledge about galaxy formation comes from computer simulations. We would like to find an observational way to determine the history of the assembly of the Galaxy. Continuing infall of gas and accretion of small galaxies also contributes to building up the Galaxy. Using chemical methods, we can find the fossil remains of the disrupted clusters and small galaxies which built up the Milky Way. In this way, we can determine observationally the history of its assembly. The technique is called chemical tagging.
We can think of a chemical space of abundances of elements Na, Mg, Al, Ca, Mn, Fe, Cu, Zr, Ba, Eu … for example (~ 25 to 30 measurable elements: the dimensionality of this space is 8 to 9) Most disk stars inhabit a sub-region of this space. Stars from chemically homogeneous aggregates like clusters will lie in tight clumps In C-space. Stars which came in from satellites may be different enough to stand out from the rest of the disk stars in chemical space. With this chemical tagging approach, we may be able to • reconstruct old dispersed star-forming aggregates in the Galactic disk •put observational limits on the satellite accretion history of the Galaxy Chemical tagging needs a high resolution spectroscopic survey of about 106 stars, homogeneously observed and analysed….. this is a prime science driver for HERMES
Summary so far • Star clusters are the main way in which stars form and build up the Galactic disk • Star clusters are chemically homogeneous • Most star clusters disrupt after about 107 years and their stars are spread around the Galactic disk • We can identify the debris of ancient disrupted star clusters, using chemical techniques, and then measure their ages. In this way, we can determine the history of the assembly of the Galactic disk.
The Galactic Thin Disk The thin disk is the major stellar component of the Milky Way. Its mass is about 4.1010 M The mean element abundance decreases as the radius increases, and there is a wide range of abundance at a given radius and age.
Luck et al 2006 The Age-Metallicity relation for subgiants in the nearby thin disk (distance < 400 pc, age errors ~ 25%). Includes stars with [Fe/H] up to about +0.4. Current belief is that they formed in inner Galaxy and migrated radially. Radial migration is big issue in GA right now: how important is it ? The Galactic abundance gradient Wylie de Boer, KCF 2013
The thick diskAlmost all spirals have thick disks: origin not understood yet. Thin and thick disk stars near the sun have different motions and [/Fe] - [Fe/H] distributions. The thick disk is old and its stars formed rapidly. thin thick Galactic thick disk stars thin disk Bensby 2012
HERMES isa new high-resolution fiber-fed multi-object spectrometer on the 4-m AAT in Australia 390 fibres over square degrees 4 bands (BGRI) ~ 1000 Å First light October 2013 - it works ! Main driver: the GALAH survey (abundances of a million stars, for chemical tagging, stellar astrophysics, Galactic structure and chemical evolution) Team of about 40, mostly from Australian institutions
GAIA is a major element of a HERMES survey HERMES and GAIA • GAIA (~ 2015) will provide precision astrometry for about 109 stars • For V = 14, = 10 as, =10as yr -1 : this is GAIA at its best • (1% distance errors at 1 kpc, 0.7 km s -1 velocity errors at 15 kpc) • accurate transverse velocities for all stars in the HERMES sample, and • accurate distances for all of the survey stars • therefore accurate color-(absolute magnitude) diagram for all of the survey stars: may give independent check that chemically tagged groups have common age.
Galactic Archaeology with HERMES The GALAH survey In Feb 2014 we will start a survey of about a million stars with V < 14 (star density matches the fiber density) At V = 14, R = 30,000, a 60 min exposure gives SNR = 100 per resolution element Do ~ 8 fields per night for ~ 400 clear nights (bright time program) Mostly thin and thick disk stars. About 70% are dwarfs like the sun: see them out to about 1 kpc. The rest are brighter giants which we see out to about 5 kpc. Measure abundances of about 25-30 elements in each star.
Assume that the debris of the birth clusters is now azimuthally mixed right around the Galaxy, so all of their formation sites are represented within our horizon Then the formation sites of about 9% of the thick disk stars and about 14% of the thin disk stars are represented within our 1 kpc dwarf horizon
Simulations show that a random sample of 106 stars with V < 14 would allow detection of about • 20 thick disk dwarfs from each of about 3,000 star formation sites • 10 thin disk dwarfs from each of about 30,000 star formation sites * A smaller survey means less stars from a similar number of sites
• Can we detect ~ 30,000 different disk sites using chemical tagging techniques ? Yes: we would need ~ 7 independent chemical element groups, each with 5 measurable abundance levels to get enough independent cells (57) in chemical space. (48 is also OK) • Are there 7 independent elements or element groups ? Yes: we can estimate the dimensionality of chemical space …
The dimensionality of the HERMES chemical space The 25 HERMES elements: Li C O Na Al K Mg Si Ca Ti Sc V Cr Mn Fe Co N Cu Zn Y Zr Ba La Nd Eu The HERMES bands (BGRI) were chosen to ensure measurable lines of these elements from the major nucleosynthesis processes. Also H and H. May get a few more elements (~ 30) in some stars. The variation of these elements from star to star is highly correlated. What is the dimensionality of the chemical C-space ?
From principal component analysis (Ting et al 2012) of the catalogs of stars available with accurate abundances of many elements, the dimensionality of the HERMES C-space is 8 to 9, but the principal components (vectors in C-space) change with metallicity. PCA includes detailed simulation of effects of observational errors on the apparent dimensionality of the C-space, element by element. The samples are fairly small (< few hundred) and not always measured homogeneously. The number of components is similar for metal-rich and metal-poor stars, but the structure of the components is different. We will be able to do this kind of analysis much better with a million homogeneously measured stars from HERMES.
The principal components are vectors in C-space of element abundances [X/Fe] and [Fe/H]. The components are eigenvectors of the correlation matrix, and are all orthogonal in the 25-dimensional C-space: therefore the higher components are projections on hyperplanes normal to the more prominent components. The C-space structure of the first principal components is clear, but it is not so obvious for the others because of the projection. • Hope that you can tell us about other techniques for analysing the structure of the chemical space which allow a more transparent interpretation of the nucleosynthetic processes. • Reduction of the dimensionality of C-space for chemical tagging is also of much interest.
e.g. the first two principal components for the low metallicity stars -3.5 < [Fe/H] < -2 (CEMP stars excluded) The first component includes all of the n-capture elements and the alpha elements. Probably related to core-collapse SN producing alpha elements plus the r-process contribution to n-capture elements. The second component shows anticorrelation of alpha elements with Fe-peak and n-capture elements - maybe related to “normal” core-collapse SN which don’t contribute to r-process.
Element abundances The chemical pipeline matches the stellar spectra to synthetic spectra via an automated version of MOOG (Wylie, Sneden). This works over the effective temperature range 4000 - 7000 K. We will observe stars outside this temperature range, but will not measure their abundances at this stage. Unusual stars (e.g. double lined binaries, chromospherically active stars) will be filtered out of the sample using spectral morphological techniques before entering the chemical pipeline (Matijevic et al 2012)
• The Ting (2011) principal components are based on samples of a few hundred stars. The GALAH sample of about a million stars should help to delineate the nature of the principal components more clearly. • The C-space for open clusters, which have Galactocentric radii RG = 6 to 20 kpc, has about one more dimension than the metal-rich solar neighborhood stars. De Silva et al 2009
[Fe/H] Te 4200 4400 4600 Te Fe, Ca, Ba abundances for stars in the open cluster Collinder 261 (de Silva et al 2007) rms scatter: [Fe/H] < 0.02, [Ca/H] < 0.05 [Ba/H] < 0.03 dex Te
SNII +SNIa rise in s-process The detailed chemical properties of surviving satellites (the dwarf spheroidal galaxies) vary from satellite to satellite, and are different from the overall properties of the disk stars. Evolution of abundance ratios reflects different star formation histories Venn (2008) LMC Pompeia, Hill et al. 2008 Sgr Sbordone et al. 2007 FornaxLetarte PhD 2007 Sculptor Hill et al. 2008 + Geisler et al. 2005 CarinaKoch et al. 2008 + Shetrone et al. 2003 Milky-Way Venn et al. 2004
A major goal is to identify how important mergers and accretion events were in building up the Galactic disk and the bulge. Cold Dark Matter simulations predicts a high level of merger activity which conflicts with some observed properties of disk galaxies. Try to find the debris of groups of stars, now dispersed, that were associated at birth, either • because they were born together in a single Galactic star-forming event, or • because they came from a common accreted galaxy.
Fractional contribution from Galactic components Dwarf Giant Thin disk 0.58 0.19 Thick disk 0.11 0.07 Halo 0.02 0.03