Download
1 / 28
280 likes | 288 Views
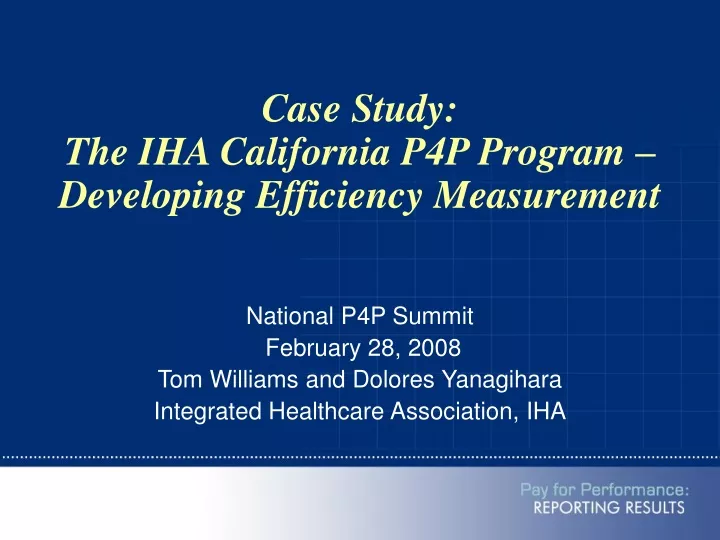
Case Study: The IHA California P4P Program – Developing Efficiency Measurement. National P4P Summit February 28, 2008 Tom Williams and Dolores Yanagihara Integrated Healthcare Association, IHA. “Efficiency Measurement: The Pot of Gold At the End of the Rainbow?”. Overview.

E N D
Case Study:The IHA California P4P Program – Developing Efficiency Measurement National P4P Summit February 28, 2008 Tom Williams and Dolores Yanagihara Integrated Healthcare Association, IHA
“Efficiency Measurement:The Pot of Gold At the End of the Rainbow?”
Overview • The Push for Efficiency Measurement • Defining Our Needs • Selecting a Vendor • Developing Measures • Getting Data • Socialization • Going Full Cycle
The Push for Efficiency Measurement • Demand by purchasers and health plans that cost be included in the P4P equation Quality + Cost = Value • Opportunity for common approach to health plan and physician group cost/risk sharing • Demonstrate the value of the delegated, coordinated model of care
Defining Our Needs • Use vendor to scrub and aggregate data health plan data, run efficiency measures, and distribute results • Use both episode-based and population-based approaches • Include both cost per unit and utilization starting in Year 1 • Adjust for both case mix and severity of illness • Balance year to year stability with inclusion of as many encounters/services/costs as possible
Defining Our Needs • Produce a single overall efficiency score as well as scores for specific clinical areas or specialties • Focus on group level measurement initially; explore feasibility of pursuing physician level reporting in future • Ensure potential for a single data submission process for efficiency and quality measurement
Defining Our Needs • Considered standardizing currently used resource use measures (admits/1000, etc.) as interim measures • Rejected – stakeholders anxious to get to sophisticated efficiency measures ASAP and didn’t want to spend resources on standardizing what was already being done
Framework: Efficiency Measurement in P4P Intermediary collect, scrub and aggregate data Translate data into one set of efficiency scores per physician group Physician group report Plan 1 data file Plan 2 data file Health plan report for payment calculations Episode and population-based measures Risk adjusted for case mix and severity of illness • Standardized and actual costs Comparative reports for improvement Plan 7 data file
Principles: Efficiency Measurement in P4P • Collaborative development/adoption • Coordination across plans • Alignment with national measures when feasible • Thorough testing and analysis prior to implementation • Transparent methodology • Risk adjustment to support fairness • Rigorous approach for validity and reliability • Actionable results to support efficiency improvement
Selecting a Vendor Selecting a Vendor November 2005 RFI sent to 13 vendors; 10 submitted responses May 2006 RFP sent to top 3 vendors May-July 2006 Sample data provided to finalists for “bake-off” (feasibility study and demonstration of capabilities) July 2006 Final vendor presentations to multi-stakeholder P4P group August 2006 Vendor selection
Developing Measures • Established Technical Efficiency Committee • Guides overall development and testing of efficiency measures • Composed of physician group, health plan, purchaser representatives and subject experts
CA Advantages for Efficiency Measurement • Unit of measure – Physician group vs. individual physician measurement makes attribution more reliable • Large sample size – Aggregation of plan data allows for adequate sample size • Consistent benefit package – HMO/POS member population provides relatively consistent benefits • Stakeholder trust – Relatively good
Basic Methodology • Population-based: Diagnostic Cost Groups (DCG) • Episode-based: Thomson’s Medical Episode Grouper (MEG), risk adjusted by MEG/Disease Staging and DCGs • Ratio of observed vs. expected cost for same episode, severity level, complexity level
Episode Construction Episode 10 CAD, Progressive Angina Look-back Clean Period Lab Prescription Hospital Admission Office Visit Office Visit Office Visit DRUG TRANSACTION FILE PATIDNDCSERVDATE 01 ISDN 95-01-15 01 INSUL 95-02-15 01 INSUL 95-04-15 01 AMOX 95-04-15 01 AMOX 95-11-15 LOOKUP TABLE NDC EPGRP ISDN 10 INSUL 359 INSUL 360 INSUL 361 AMOX 484 AMOX 86
Efficiency Measures 1. Generic prescribing • Calculated by cost and by number of scripts 2. Overall Group Efficiency • Episode and population based methodologies • Calculated using both standardized and actual costs 3. Efficiency by Clinical Area • Calculated using standardized costs 4. Actual to Standardized Pricing Indices
Generic Prescribing • Focus on four therapeutic areas: • Statins • PPIs • SSRIs / SNRIs • Nasal steroids • Cost (or # of scripts) for All Generic Rx in 4 Tx areas Cost (or # of scripts) for All Rx in 4 Tx areas • No risk adjustment
Overall Group Efficiency • Population-based: Average Observed costs PMPY Average Expected costs PMPY • Episode-based: Sum of Observed costs for all episodes Sum of Expected costs for all episodes • Risk adjusted • patient complexity • disease severity • geographic wage differences
Efficiency by Clinical Area • Areas of high variation, high cost • Examples of possible clinical areas include: Diabetes, Asthma, Acute Low Back Pain, Hypertension, Cardiovascular (CHF, AMI, CAD, Angina), COPD • Sum of Observed costs for all episodes in clinical area Sum of Expected costs for the same set of episodes • Risk adjusted • patient complexity • disease severity • geographic wage differences
Actual to Standardized Pricing Indices • Ratio of actual costs to standardized costs, overall and for different service categories • Directly identifies relative pricing differences for any available service category breakdowns • Examples of service category breakdowns: professional, facility inpatient, facility outpatient, radiology, lab, Rx • FFS: sum of allowed amounts for services in denominator sum of standardized costs for all FFS services in claims • Capitated: total capitation amount paid to group standardized costs for all services on capitated encounters
Methodological Considerations • Use internal benchmarks to calculate “expected” • Based on the average risk adjusted cost across all 7 health plans • 12 month measurement period, unless otherwise indicated through testing • Outlier methodologies to eliminate 1% of highest and lowest cost episodes • Clinical exclusions to be determined (e.g. transplants)
Getting Data • Sign Business Associate Agreements • 15 months and counting for one health plan • Address antitrust concerns • Opinion from legal counsel • Guidelines for acceptable reporting • Confidentiality clauses in contracts • Obtain Consent to Disclosure Agreements • Physician Groups • Hospitals
Getting Data • Explore using public sources of data for hospital costs • Obtain useable data from health plans • Multiple data submissions needed
Impact on Timing of Measurement Standardized Costs Actual Costs Generic Prescribing MY 2007 MY 2009 MY 2008 MY 2009 Population-based • overall efficiency MY 2007 MY 2007 Episode-based • overall efficiency • efficiency by clinical area MY 2007 MY 2007 MY 2008 MY 2008 MY 2009 MY 2009 MY 2008 MY 2008 MY 2007 MY 2007 MY 2009 MY 2009 Actual to Standardized Pricing Indices MY 2009
Socialization of Efficiency Measurement Communication • Breakout sessions at annual P4P Stakeholders meetings and annual CAPG conferences • Audio conference updates • Newsletter articles • Regional meetings to explain how to understand and use results for performance improvement (planned) Policy • Delay sharing of group-specific results
Efficiency Measurement: Reporting PO ‘08 / ‘10 Plan ‘08 / ‘10 Public ‘08 / ‘10 all episode groups combined Yes / Yes No / Yes No / Yes No No No / TBD episode groups in selected clinical areas Yes / Yes No / Yes No / TBD No No by service type within each selected clinical area Yes / Yes No / No No / Yes No each episode, by service type and by disease severity / patient complexity stratification Yes / Yes No / No No No / TBD care for all members in PO Yes / Yes No / TBD No No / Yes summary information (min, max, mean, SD, percentiles) Yes / Yes Yes / Yes No / No
Going Full Circle • Development of episode and population-based measures taking too long • Need to address affordability of HMO product now • Attempting to standardize currently used resource use measures (admits/1000, etc.) for immediate implementation
For more information:www.iha.org dyanagihara@iha.org (510) 208-1740