Download
1 / 53
550 likes | 680 Views
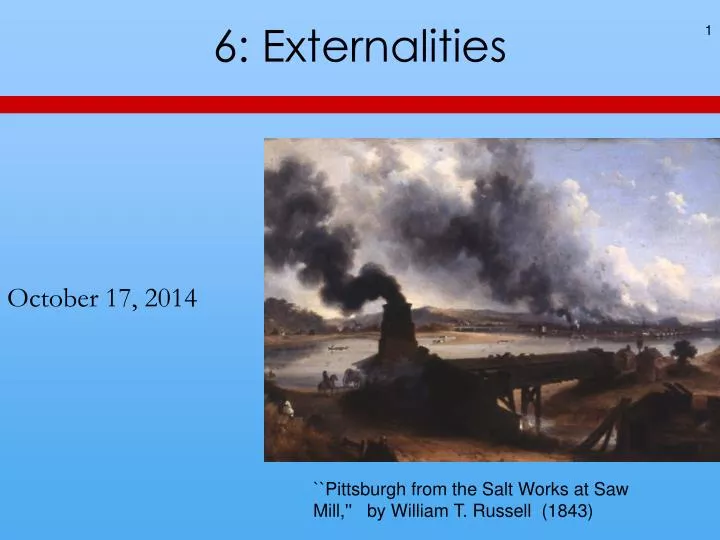
6: Externalities. October 17, 2014. ``Pittsburgh from the Salt Works at Saw Mill,'' by William T. Russell (1843). ``Pittsburgh from the Salt Works at Saw Mill,'' by William T. Russell (1843). Pollution Externalities and Licenses. Licensing vs. Regulation. A Pollution Tax.

E N D
6: Externalities October 17, 2014 ``Pittsburgh from the Salt Works at Saw Mill,'' by William T. Russell (1843)
``Pittsburgh from the Salt Works at Saw Mill,'' by William T. Russell (1843)
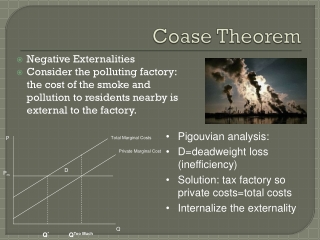
Cap and Trade vs. Pollution Taxes If it is very important to avoid letting total pollution cross some particular threshold where its marginal cost rises sharply, regulating quantity this way is better than putting a price on it. If it may be very beneficial to let output (and pollution) rise above a particular level, a pollution tax is better. If companies must buy their initial pollution permits, the quantity policy can, like the tax policy, raise revenue.
EPA and EEX Auctions The test U.S. auctions are at “Clean Air Markets,” http://www.epa.gov/airmarkets/trading/2011/index.html . Note the environmentalists. Europe: http://petrolog.typepad.com/climate_change/2009/07/spot-price-of-eu-emission-allowances.html
Selling Allowances Can Pay Better than Steelmaking The Kyoto Protocol of 1997 required signing countries to reduce their carbon emissions. The European Union in 2005 launched its own cap-and-trade system. Corus, Europe’s second-largest steel producer, closed its U.K. steelmaking plant at Redcar, cutting 1,700 jobs. It has 7.5 million carbon dioxide allowances. At e15/tonne, that’s worth 112.5 million euros, Is the plant closing good, or bad?
The Summers World Bank Memo DATE: December 12, 1991 TO: Distribution FR: Lawrence H. Summers Subject: GEP ’Dirty’ Industries: Just between you and me, shouldn’t the World Bank be encouraging MORE migration of the dirty industries to the LDCs [Less Developed Countries]? I can think of three reasons:
Summers Memo pp 1, 5 http://ban.org/whistle/summers.html
Summers Memo, first part 1) The measurements of the costs of health impairing pollution depends on the foregone earnings from increased morbidity and mortality. From this point of view a given amount of health impairing pollution should be done in the country with the lowest cost, which will be the country with the lowest wages. I think the economic logic behind dumping a load of toxic waste in the lowest wage country is impeccable and we should face up to that.
Summers Memo, second part 2) The costs of pollution are likely to be non-linear as the initial increments of pollution probably have very low cost. I’ve always thought that under-populated countries in Africa are vastly UNDER-polluted, their air quality is probably vastly inefficiently low compared to Los Angeles or Mexico City. Only the lamentable facts that so much pollution is generated by non-tradable industries (transport, electrical generation) and that the unit transport costs of solid waste are so high prevent world welfare enhancing trade in air pollution and waste.
Summers Memo, third part 3) The demand for a clean environment for aesthetic and health reasons is likely to have very high income elasticity. The concern over an agent that causes a one in a million change in the odds of prostrate cancer is obviously going to be much higher in a country where people survive to get prostrate cancer than in a country where under 5 mortality is 200 per thousand. Also, much of the concern over industrial atmosphere discharge is about visibility impairing particulates. These discharges may have very little direct health impact. Clearly trade in goods that embody aesthetic pollution concerns could be welfare enhancing. While production is mobile the consumption of pretty air is a non-tradable
THE COASE THEOREM: But why do we need the government to establish licenses? If information is symmetric, negotiation is costless, and contracts are costlessly enforceable, then people will choose surplus-maximizing actions regardless of whether there are externalities and regardless of who has the property rights.
A Coase Theorem Example • A paper mill is polluting a river. The farmer downstream • had been selling trout fishing rights to rich tourists for • $20,000. • Now the trout have fled, and he gets zero. • The factory could install filtering machinery that would • eliminate the pollution, at a cost of $4,000. • Suppose the farmer has the right to a clean river. • 2. Suppose the factory has the right to dump its waste • water into the river.
What if Pollution Is Efficient in the Trout Example? Let the trout fishing income be $2,500, not $20,000. Let mitigation cost stay at $4,000. If the farmer has the right to clean water, what happens? If the factory has the right to dispose of waste in the river, what happens?
How the Coase Theorem Assumptions Break Down Farmer benefit from trout: $20,000. Factory filtering machinery cost: $4,000. If information is symmetric (that is, the players don’t differ too much in their information) . . . If negotiation is costless (that is, not too costly) . . . If contracts are costlessly enforceable, (that is, not too costly) . . .
The Town of Cheshire Buyout American Electric Power had a polluting coal plant in Cheshire, southeast Ohio, that locally produced bothersome air pollution. The company bought most of the town for $20 million, supposedly for plant expansion. Most of the 221 residents of Cheshire left. 90 homeowners were paid three times the value of their houses. They signed away their suing rights.
Applications of the Coase Theorem 1. Bees and crops that need pollination. http://pollinationconnection.com/beekeepers 2. Inefficient contract law is not so harmful as inefficient tort law. If the standard contract rule is not value-maximizing, the two parties can write in a special clause. Binding arbitration, for example. 3. Coase’s example of two adjacent radio frequencies interfering with each other. Clear property rights are enough. 4. Buying out bad employees (IU presidents, coaches)
Extortion: SaveToby.com http://www.rasmusen.org/g406/save-toby-com.pdf http://www.theregister.co.uk/2005/04/13/rabbit_extortion/ “Toby Has Finally Been Saved!!!!!” http://www.savetoby.com/.
The Science of Global Warming Carbon dioxide is generated when people burn coal, oil, or wood, or make cement from calcium carbonate. Carbon dioxide is absorbed when plants grow. If the earth has high carbon dioxide and water vapor levels, that keeps heat from leaving, a “greenhouse” effect. (Greenhouses keep heat from leaving an enclosed space.) We do not really know what causes Ice Ages.
Reasons for Concern Carbon dioxide emissions have quadrupled since 1950. The preindustrial amount of atmospheric CO2 was 280ppm (parts per million). Since 1960 it’s increased steadily from 315 to 390 ppm. Average global temperature rose 1 degree Farenheit from 1980 to 2000. The sea level rose 80mm from 1970 to 2000.
Global Temperatures 1880-2012 Look at the vertical axis: it is anomalies, not average temperature. Source: http://data.giss.nasa.gov/gistemp/graphs_v3/
World Temperatures 1996-2012 http://data.giss.nasa.gov/gistemp/graphs_v3
U.S. Temperatures 1880-2010 http://data.giss.nasa.gov/gistemp/graphs_v3
Bloomington Temperatures NASA’s map for world weather station time series is at http://data.giss.nasa.gov/gistemp/station_data/.
Cambridge Temperatures NASA’s map for world weather station time series is at http://data.giss.nasa.gov/gistemp/station_data/.
A Badly Located Weather Station http://www.surfacestations.org/
Satellite-Measured Temperature Source: Roy Spencer, http://www.drroyspencer.com/latest-global-temperatures/.
What’s Happened, Summary The preindustrial amount of atmospheric CO2 was 280ppmv. Since 1960 it’s increased from 315 to 380 ppmv, to 0.038% of the atmosphere. Average global temperature rose about 1 degree Farenheit from 1980 to 2000. It also rose .5 degrees from 1910 to 1940, which can’t have been because of C02. The temperature has levelled off since 2000. The sea level rose 100mm from 1970 to 2000. It also rose 100mm from 1880 to 1970, which can’t have been because of CO2.
Costs of Global Warming Decreased water except at high latitudes and moist tropical areas. Loss of coastland and coastal swamps. Less food production at low latitudes. Coral death from more acidic oceans. The biggest question is how temperature affects water patterns. Humidity will rise, but be unevenly spread. http://www.ipcc.ch/publications_and_data/ar4/syr/ en/mains3-3-1.html Global Warming Costs and the Discount Rate http://rasmusen.org/g406/older/discounting.xls
The Nordhaus Plan Reduce carbon dioxide 15 percent 2015-2050 relative to what it would be without regulation. Reduce by 25 percent after 2050-2100 and 45 percent after 2100. Since without regulation emissions would grow, they would still rise under this plan, but more slowly. He suggests a carbon tax of $28 per ton ($8/ton of CO2). Americans emit 5 tons per year on average now. That means 9 cents per gallon on gasoline, and a 10% tax on coal-generated electricity. At current levels, this would raise $50 billion per year of revenue. http://nordhaus.econ.yale.edu/dice_mss_072407_all. pdf
Costs– in Numbers The IPCC, a U.N. organization, says that if carbon dioxide isn’t stabilized till the late 21st century, the temperature will increase about 7.2 degrees Farenheit . (http://www.ipcc.ch/publications_and_data/ar4/syr/en/spms3.html, “A1F1 scenario,” worst-case, Table SPM-1.) Yale economist William Nordhaus says that we should spend a present value of $2.2 trillion on abatement, saving $5.2 trillion in warming costs. http://nordhaus.econ.yale.edu/dice_mss_072407_all.pdf That’s equivalent at a 5% discount rate to spending $110 billion per year on abatement.
EPA vs. Massachusetts In 1999, 19 private organizations filed suit demanding that the EPA regulate greenhouse gas emissions. Fifteen months later, the EPA requested public comment. It received more than 50,000 comments. The EPA concluded that carbon dioxide was not an “air pollutant,” so it had no authority to regulate it. The EPA’s denial was challenged in court, and the EPA lost in the Supreme Court. In 2009 it issued an endangerment finding, and it has started regulating mileage of cars. It can only use command-and-control.
Can the EPA Regulate Carbon Dioxide? US Code 42. §7521. “Emission standards for new motor vehicles or new motor vehicle engines” says: (1) The Administrator shall by regulation prescribe (and from time to time revise) in accordance with the provisions of this section, standards applicable to the emission of any air pollutant from any class or classes of new motor vehicles or new motor vehicle engines, which in his judgment cause, or contribute to, air pollution which may reasonably be anticipated to endanger public health or welfare.”
The Garden Hose to the Sky http://freakonomics.com/2011/09/02/finally-a-garden-hose-to-the-sky/ http://www.intellectualventures.com/about/leadership/nathan-myhrvold/
Solutions to Global Warming 1. Reduce carbon emissions: Taxes, tradable permits, command and control. Cost: $2.2 trillion (Nordhaus) 2. Subsidize nuclear energy, wind, solar. 3. Carbon sequestration: Plant trees. 4. Carbon sequestration: Lock carbon up under the ground. 5. Geoengineering: Fertilize the ocean with iron. Cost= $300-500 billon. (5% discount rate) 6. Geoengineering: Put light-blocking substances into the atmosphere. Cost: $20-160 billion. (Barrett 2008) 7. Amelioration: air conditioning, shifting to different crops, higher sea walls, and so forth.
Helping Poor Countries Costs and benefits of warming are unevenly distributed. Russia, Canada, and the United States could actually benefit from having less cold winters. Tropical countries– which are poorer– would lose more. But for 1 trillion dollars per year, what else could be done to help poor countries? Should we reduce economic growth now to help people in Bangladesh in 2100? Or should we help people in Bangladesh in 2011?
Lots of Countries Produce Carbon Dioxide (2007) China produced 22%, the US 20%, the European Union 14%, India 6%, Russia 5%, and Japan 4%. Other countries producing more than 1% were Canada, South Korea, Iran, Mexico, South Africa, Saudi Arabia, Indonesia, Australia, Brazil, and Ukraine. http://en.wikipedia.org/wiki/List_of_countries_by_ carbon_dioxide_emissions from http://mdgs.un.org/ unsd/mdg/SeriesDetail.aspx?srid=749&crid=
Summary The main economic costs of global warming would be from water changes— drought and flood. Europe uses cap-and-trade. The EPA is starting to impose command-and-control. Carbon taxes are another solution. These can all include sequestration and offsets. All solutions except adaptation face the problem that countries can free-ride. Geoengineering solutions are potentially the cheapest. The big growth in carbon is in developing countries because of their big population and income catch-up to developed countries.