Download
1 / 9
90 likes | 99 Views
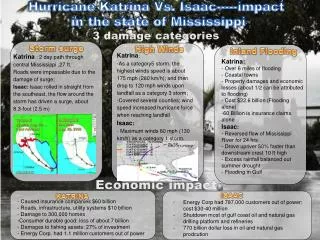
Storm Surge Atlases Presentation, description, data. Horace H. P. Burton and Selvin DeC. Burton Caribbean Institute for Meteorology and Hydrology. Storm Surge Atlas - Contents.

E N D
Storm Surge AtlasesPresentation, description, data Horace H. P. Burton and Selvin DeC. Burton Caribbean Institute for Meteorology and Hydrology
Storm Surge Atlas - Contents Atlas contains maps of MEOWs of various combinations of storm direction, forward speed, and intensity for the islands of the English-speaking Eastern Caribbean.
Map Features • Each map depicts maximum surge likely during the passage of a tropical cyclone of specific intensity, moving at given speed, from given direction and within a specified distance of the particular island • Maps are colour shaded with legend indicating the range of values assigned to each colour
Map Features • Added to each map is a country outline obtained from the base topography/bathymetric data of the TAOS model. • Storm surge heights above mean sea-level are shown at intervals of 0.25 m up to 2 m and at intervals of 0.5 m for higher values • Actual water on land is obtained by subtracting the land elevation from the surge estimate
Input Data • Tracks and speeds - regional climatology • Intensities - Saffir-Simpson scale • Lateral distance - typical horizontal extent of hurricane force winds • Radius of maximum winds - observations
Map scale • The surge height represents the value over some finite distance determined by the model - 1 km • This value is sufficiently large to be used by decision makers in planning and disaster management
Uses • Determine level of risk and relative vulnerability of specific areas on basis of intensity and track • Determine vulnerability of existing facilities - important for type and urgency of actions • Determine areas susceptible to coastal and inland flooding from storm surge • Understanding characteristics of storm surge
Limitations • Cannot be uses for individual parcel analysis • In present form cannot be used to determine directly the extent of coastal flood zone - absence of topography • Lack of detailed coastal outline may have an affect on surge heights in smaller bays Possible uses far outweigh limitations