Download
1 / 69
690 likes | 872 Views
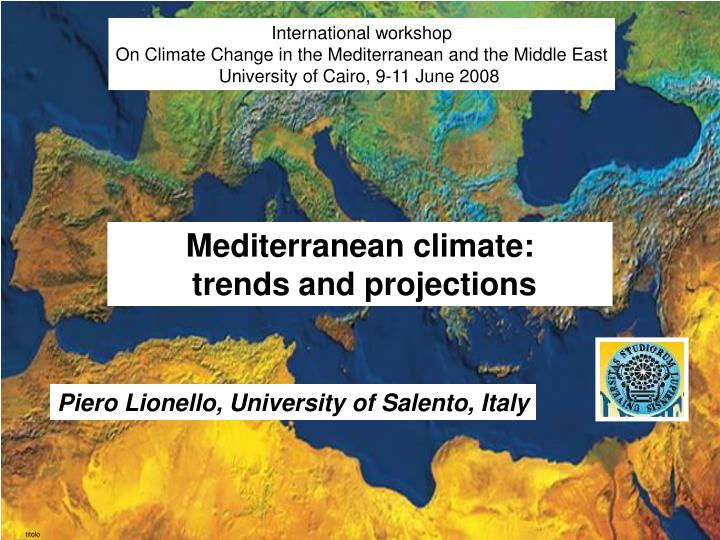
International workshop On Climate Change in the Mediterranean and the Middle East University of Cairo, 9-11 June 2008. titolo. Mediterranean climate: trends and projections. Piero Lionello, University of Salento, Italy. International workshop

E N D
International workshop On Climate Change in the Mediterranean and the Middle East University of Cairo, 9-11 June 2008 titolo Mediterranean climate: trends and projections Piero Lionello, University of Salento, Italy
International workshop On Climate Change in the Mediterranean and the Middle East University of Cairo, 9-11 June 2008 University of Cairo, 9-11 June 2008 Sommario • Contents • Remarks on the Mediterranean climate • A review of present trends • Information from climate projections
koeppen Vladimir Petrovič Köppen Russian geographer , botanist and climatologist (S. Petersburg, 1846 – Graz, 1940)
Main groups A tropical climate B arid climate: C mid latitude temperate climate D mid latitude cold climate E polar climate H mountain climate Classificazone 1 Sub-groups : S steppeW desert f wet w winter dry season s summer dry season m: rain forest Af, Am: monsoon, tropical rain forest. Aw: savannah BS: steppe. BW: desert. Cw: temperate mid latitude with dry winter Cf: temperate mid latitude without dry season Cs: temperate mid latitude with dry summer. Df: cold rainy during the whole year. ET: tundra. EF: frost 3rd level classification a, b,c hot summer (T warmest month > 22°C), warm summer (warmest month < 22°C), cold summer (T less than 4 months > 10°C (climates C and D). d: very cold winter (T coldest month < -38°C (climate D). h, k: hot, cold (average year temperature higher/lower than 18°C < (climate B).
Koeppen global Updated world map of the Köppen-Geiger climate classification M. C. Peel, B. L. Finlayson, and T. A. McMahon Hydrol. Earth Syst. Sci. Discuss., 4, 439–473, 2007 The 30 possible climate types are divided (without accounting for H)into: 3 tropical (Af, Am and Aw), 4 arid (BWh, BWk, BSh and BSk), 9 temperate (Csa, Csb, Csc, Cfa, Cfb, Cfc, Cwa, Cwb and Cwc), 12 cold (Dsa, Dsb, Dsc, Dsd, Dfa, Dfb, Dfc, Dfd, Dwa, Dwb, Dwc and Dwd) and 2 polar (ET and EF).
International workshop On Climate Change in the Mediterranean and the Middle East University of Cairo, 9-11 June 2008 University of Cairo, 9-11 June 2008 Med climate What is the Mediterranean Climate ?
Koeppen eu 10 out of 30 Köppen climate types are present around the Mediterranean Sea
Koeppen considerazioni • Csa/Csb temperate climate with dry hot/warm summer season • Cfa/Cfb temperate climate without dry season and with hot/warm • Dsa, Dfb cold climate, without dry season but warm summer and with hot dry summer • BWh BWk hot and cold desert, BSh BSk hot and cold steppe Large areas of the Mediterranean region do not have the “CsA/CsbMediterranean” climate … and there is some Mediterranean climate outside the Mediterranean region
Past winter temperature (DJF) Tise T past Luterbacher J. et al. (2005), Mediterranean climate variability over the last centuries: a review In P.Lionello, P.Malanotte-Rizzoli, R.Boscolo (eds) Mediterranean Climate Variability. Amsterdam: Elsevier (NETHERLANDS).
Warmest-coldest Luterbacher J. et al. (2005),
Tise prec past Past winter precipitation (DJF) Luterbacher J. et al. (2005),
Driest-wettest Luterbacher J. et al. (2005),
University of Cairo, 9-11 June 2008 Considerazioni: time variabiity Large variability at inter-annual and inter-decadal scale is a basic characteristic of the Mediterranean region …However, the temperature increase during the second half of the 20th century in unprecedented in historical records
University of Cairo, 9-11 June 2008 Tendenze 20mo secolo Focus on 20th century Graphics based on CRU climatology, interpolated from station data to 0.5 degree lat/lon grid ( New, M., M. Hulme and P. Jones, 1999: Representing twentieth-century space-time climate variability. Part I: Development of a 1961-90 mean monthly terrestrial climatology. J. Climate, 12, 829-856.
Precipitation 1901 - 1925 Pre_season 1901-1925 DJF MAM JJA SON
Precipitation 1975 -2000 Pre_season_1975_2000 DJF MAM JJA SON
Precipitation trends 1901 - 1925 Pre_MK 1901-2000 DJF MAM JJA SON
Precipitation trends1975 - 2000 Pre_MKmsk 1901-1925 DJF MAM JJA SON
Precipitation trends 1975 - 2000 Pre_MK 1975-2000 DJF MAM JJA SON
Precipitation trends 1975 - 2000 Pre_MKmsk 1975-2000 DJF MAM JJA SON
Precipitation trends 1901 -2000 Pre_MK_msk 1901-2000 DJF MAM JJA SON
Elena wet season Wet season precipitation trend (1950-1999) Acknowledgement: Xoplaki, 2002; Xoplaki et al., 2004 mm/50years
Elena dry season Dry season precipitation trend (1950-1999) Acknowledgement: Xoplaki, 2002; Xoplaki et al., 2004 mm/50years
Temperature 1901 - 1925 tmp_season_1901_1925 DJF MAM JJA SON
Temperature 1975 - 2000 tmp_season_1901_2000 DJF MAM JJA SON
Temperature trend 1901 - 1925 tmp_MKmsk_1901_1975 DJF MAM JJA SON
Temperature trend 1975 - 2000 tmp_MKmsk_1975_2000 DJF MAM JJA SON
Temperature trend 1901 - 2000 Tmp_MKmsk-1901-2000 DJF MAM JJA SON
Comment tmp and pre Though there is a possibly widespread over-perception of precipitation trends, reduction of (winter) precipitation is observed over large areas of the Mediterranean region. The signal for temperature is much clearer than for precipitation: there is positive trend with an acceleration during the last part of the 20th century involving the whole Mediterranean region University of Cairo, 9-11 June 2008
Models Climate model projections Schematic view of the components of the climate system, their processes and interactions. From IPCC 4th AR
From IPCC 4th AR Scenarios • CO2 emissions in SRES (Nakicenovic et al, 2000) : • A-B rispettivamente forte e ridotto fabbisogno energetico; • 1-2 rispettivamente sviluppo mondiale omogeneo e eterogeneo.
Model mean reliability From IPCC 4th AR Figure TS.23. (a) Global mean surface temperature anomalies relative to the period 1901 to 1950, as observed (black line) and as obtained from simulations with both anthropogenic and natural forcings. The thick red curve shows the multi-model ensemble mean and the thin lighter red curves show the individual simulations. Vertical grey lines indicate the timing of major volcanic events. (b) As in (a), except that the simulated global mean temperature anomalies are for natural forcings only. The thick blue curve shows the multi-model ensemble mean and the thin lighter blue curves show individual simulations. Each simulation was sampled so that coverage corresponds to that of the observations. {Figure 9.5}
Mean projection From IPCC 4th AR Time series of globally averaged (left) surface warming (surface air temperature change, °C) and (right) precipitation change (%) from the various global coupled models for the scenarios A2 (top), A1B (middle) and B1 (bottom). Numbers in parentheses following the scenario name represent the number of simulations shown. Values are annual means, relative to the 1980 to 1999 average from the corresponding 20th-century simulations, with any linear trends in the corresponding control run simulations removed. A three-point smoothing was applied. Multi-model (ensemble) mean series are marked with black dots. See Table 8.1 for model details.
International workshop On Climate Change in the Mediterranean and the Middle East University of Cairo, 9-11 June 2008 University of Cairo, 9-11 June 2008 Ensemble mean med Ensemble mean projections for the Mediterranean region Using GLOBAL models
List of models Grid interval 20C B1 A1B A2 MODEL CCMA-3-T47 ~2.7 deg 5 4 4 2 CNRM-CM3 ~2.8 deg 1 1 1 1 CSIRO-MK3 ~2.3 deg 2 1 1 1 GFDL-CM2-0 ~2.2 deg 3 1 1 1 GFDL-CM2-1 ~2.2 deg 3 0 1 1 GISS-AOM ~3.5 deg 2 2 2 0 GISS-E-R ~4.5 deg 1 1 2 1 INMCM3 ~4.5 deg 1 1 1 1 IPSL-CM4 ~3.0 deg 1 1 1 1 MIROC3-2H ~1.2 deg 1 1 1 0 MIROC3-2M ~2.8 deg 3 3 3 3 MIUB-ECHO-G ~3.2 deg 5 3 3 3 MPI-ECHAM5 ~2.3 deg 3 3 2 3 MRI-CGCM2 ~2.8 deg 5 5 5 5 NCAR-CCSM3 ~1.4 deg 8 8 6 4 NCAR-PCM1 ~2.8 deg 4 2 3 4 UKMO-HADCM3 ~3.0 deg 1 1 1 1 List of models, grid interval (atmosphere) and experiments used in this work. 20C indicates experiments for the 20c century, B1, A1B and A2, experiments for the 21st century under forcing deriving from the corresponding IPCC emission scenarios. The grid interval is approximate, as it may vary across latitudes and may be different in the longitude and latitude directions. More detailed information on models and experiments is available the PCMDI web site http://www-pcmdi.llnl.gov for.
risoluzione space resolution !!!! One obvious limitation of these simulations is resolution. This might have important consequences for the climate change signal in region where it shows a sharp gradient, likely associate with the geomorphology of the region: precipitation in the middle east in Summer and Fall, precipitation along the northern boundary of the Mediterranean region (Pyrenees, Alps, Balkans).
Risoluzione 5 5 degs
Risoluzione 4 4 degs
Risoluzione 3 3 degs
Risoluzione 2 2 degs
Risoluzione 1 1 degs
Risoluzionem 0.5 0.5 degs
Risoluzione 0.2 0.2 degs
Risoluzione 0.1 0.1 degs
CC_Pre B1 Precipitation change (%, 2071-2100 minus 1961-1990), MGME ensemble average, B1 scenario DJF MAM JJA SON Figure 6 from Giorgi and Lionello, 2007
CC_Pre A1B Precipitation change (%, 2071-2100 minus 1961-1990), MGME ensemble average, A1B scenario DJF MAM JJA SON Figure 4 from Giorgi and Lionello, 2007
CC_Pre A2 Precipitation change (%, 2071-2100 minus 1961-1990), MGME ensemble average, A2 scenario DJF MAM JJA SON Figure 7 from Giorgi and Lionello, 2007
CC_tmp_A1B Temperature change (C, 2071-2100 minus 1961-1990), MGME ensemble average, A1B scenario DJF MAM JJA SON from Giorgi and Lionello, 2007 Figure 5
Tmp-prec total (2081-2100) minus (1961-1980) MGME ensemble average change in mean precipitation (upper panel) and mean surface air temperature (lower panel) for the full Mediterranean region, the four seasons and different scenario. The changes are calculated between the periods 2081-2100 and 1961-1980 and include only land points. Units are % of 1961-1980 value for precipitation and degrees C for temperature from Giorgi and Lionello, 2007