Download
1 / 27
270 likes | 388 Views
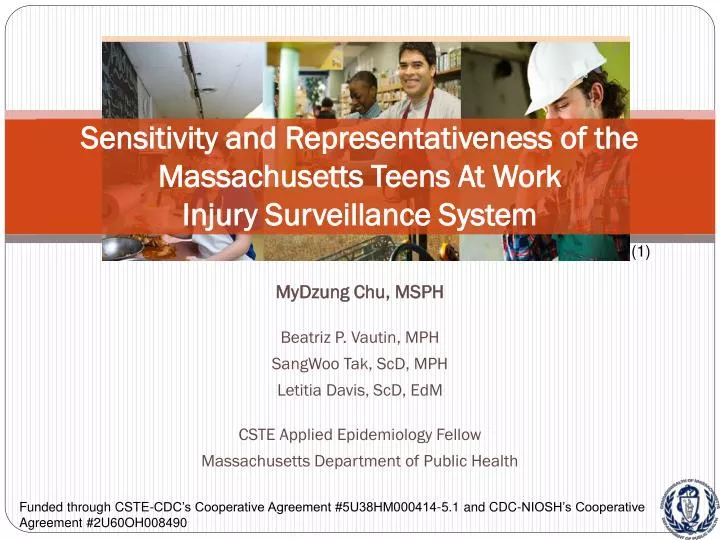
Sensitivity and Representativeness of the Massachusetts Teens At Work Injury Surveillance System. (1). MyDzung Chu, MSPH Beatriz P. Vautin , MPH SangWoo Tak , ScD, MPH Letitia Davis, ScD, EdM CSTE Applied Epidemiology Fellow Massachusetts Department of Public Health.

E N D
Sensitivity and Representativeness of the Massachusetts Teens At Work Injury Surveillance System (1) MyDzung Chu, MSPH Beatriz P. Vautin, MPH SangWooTak, ScD, MPH Letitia Davis, ScD, EdM CSTE Applied Epidemiology Fellow Massachusetts Department of Public Health Funded through CSTE-CDC’s Cooperative Agreement #5U38HM000414-5.1 and CDC-NIOSH’s Cooperative Agreement #2U60OH008490
Nearly 70 die from work-related injuries (2). In MA, 900+ teens seek ER care for work injuries every year (2). Designed by Shari Coté, 1st Place Winner of MA’s 2013 Safe Jobs for Youth Poster Contest (3)
Teens At Work (TAW) Injury Surveillance System: Population and Sentinel (3,4) Goal: Reduce the incidence of work-related (WR) injuries to young workers, by: • Case definition:A traumatic injury to a person under age 18 while the person was working for pay, • that was medically treated, or • for which a workers’ compensation lost-time claim has been filed, or • that was fatal.
Multi-source system Data sources TAW surveillance activities
TAW Surveillance System Evaluation Targeted attributes (5) • Data quality • Predictive Value Positive (PVP) • Representativeness of sample ED cases • “Macro” Sensitivity
i. Are the current sample ED cases representative of state-wide ED cases based on demographic, employment, and injury characteristics? Methods: • 2009 sample and statewide ED cases • Removed duplicates and illnesses • Extracted medical records: • Evaluated misclassification of ‘WC as expected payer’ variable • TAW coded industry (NAICS)(6) and occupation (COC)(7) • Coded injury (OIICS) from ICD-9 crosswalk(8) • Compared percent distributions • χ2 Goodness-of-fit, significance at p<0.05
Sample EDs Statewide EDs Results: Demographics i. Are the current sample ED cases representative of state-wide ED cases based on demographic, employment, and injury characteristics?
Results: Employment and Injury type Sample EDs Statewide EDs Yes – all χ2 p >0.05 i. Are the current sample ED cases representative of state-wide ED cases based on demographic, employment, and injury characteristics?
ii. What regions of the state should TAW target to a) increasegeographic representativeness of sample EDs and b) address regions with highest injury rates? I. Representativeness of sample ED cases Northeast Central Western Boston Metro West Southeast Statewide EDs (9)
Method: • 2005-2009 statewide ED • Removed duplicates and ineligible cases • Calculated rates per Public Use Microdata Areas (PUMAs) • PUMA: population of 100,000+(10) • MA has 48 PUMAs • Link Census towns/cities to PUMAs • Denominator: American Community Survey (ACS)(11,12) • 16-17-year old workers • Identify: • PUMAs with the highest WR injury rates that are not represented by the current sample EDs ii. What regions of the state should TAW target to a) increase geographic representativeness of sample EDs and b) address regions with highest injury rates?
Results:PUMAs with high WR injury rates not represented by current sample EDs, 2005-2009 PUMAs (rate ≥ 15.4): 100, 300, 1100, 1700, 1800, 1900, and 4300 Mean rate: 12.2/1000 worker ii. What regions of the state should TAW target to a) increase geographic representativeness of sample EDs and b) address regions with highest injury rates? (9)
Conclusions and Recommendations Question 1: Should TAW recruit more EDs into its sample to increase its representativeness? Which ones? • From PUMAs with high WR injury rates not currently represented by the sample (i.e. 100, 300, 1100, 1700, 1800, 1900, and 4300) • TAW does not need to recruit more EDs • Demographic, employment, and injury data of the current sample ED cases were representative of state-wide ED cases. • Yet, to improve it’s geographic representativeness, TAW should consider recruiting more EDs 14
II. ‘Macro’ Sensitivity Question 2: How well does TAW capture non-fatal WR injuries to teens <18 in MA? Challenge: Is there a ‘gold standard’? • TAW is the only state-based multi-source surveillance system for WR injuries to teens <18 • Lack of an appropriate external comparison • Considered ‘Macro’ comparison with Bureau of Labor Statistics’ annual Survey of Occupational Injuries and Illnesses (SOII) estimates for MA (13) • SOII often used as official est. of occupational safety and health conditions nationwide and for some states (14) • Comparison has limitations (14)
Data systems comparison for non-fatal injuries to teens <18 (14) 2. How well does TAW capture non-fatal WR injuries to teens under 18 in MA?
II. ‘Macro’ Sensitivity Methods: • 2005-2008 TAW and SOII, 16-17-year olds • Developed SAS program to identify TAW overlaps • Accounted for • Est. illnesses (<3.27%) in SOII • Overlaps (8.44%) and est. non-WR ED cases (1.33%) in TAW • Calculate incidence ratio 2. How well does TAW capture non-fatal WR injuries to teens under 18 in MA? 17
Results: Comparison of TAW & SOII's non-fatal WR injuries in MA, 2005-2008 2. How well does TAW capture non-fatal WR injuries to teens under 18 in MA? 18
Conclusions and Recommendations TAW captured an average of 1.7x more cases than SOII Question 2: How well does TAW capture non-fatal WR injuries to teens <18 in MA? • TAW should continue to use multiple data sources • Overlaps should be accounted for • TAW can use SOII as a crude comparison for capture rate • Yearly evaluation, expect TAW cases > SOII est. • Public industries available for SOII data 2008+ 19
Usefulness of TAW Surveillance System Declining rates of WR injuries to 15-17-year olds in MA WC claim data, 1994-2008: -5.5% annual change 1993: TAW starts 1994: OSHA educ. materials dev. through comm. project
Thank you! Acknowledgements: Beatriz P. Vautin, MPH & Sara Rattigan, MS Massachusetts Teens at Work: Injury Surveillance & Prevention Project 617-624-5677 | Teens.atwork@state.ma.us www.mass.gov/dph/teensatwork Contact: MyDzung Chu, MSPH MyDzung.chu@state.ma.us 22
References (1) National Institute for Occupational Safety and Health. 2013. Health and Safety of Young Workers. Proceedings of a U.S. and Canadian Series of Symposia. Accessed on 05/15/2013 at http://www.cdc.gov/niosh/docs/2013-144/pdfs/2013-144.pdf (2) Massachusetts Department of Public Health. 2011. Massachusetts Guide for Working Teens. Accessed on 05/10/2013 at http://www.mass.gov/eohhs/docs/dph/occupational-health/ma-guide-working-teens.pdf (3) Occupational Health Surveillance Program. Massachusetts Department of Public Health. http://www.mass.gov/eohhs/gov/departments/dph/programs/health-stats/ohsp/ (4) Protecting young workers: A Guide for Building a State Surveillance System for Work-Related Injuries to Youths. MDPH with Education Development Center, Inc. Spring 2005. Accessed at: http://www.mass.gov/eohhs/docs/dph/occupational-health/how-to-guide.pdf (5) Morbidity and Mortality Weekly Report (MMWR). Updating Guidelines for Evaluating Public Health Surveillance Systems: Recommendations from the Guidelines Working Group. Centers for Disease Control and Prevention. US Department of Health and Human Services 2001. Vol. 50 / No. RR-13: 1-36. (6) Office of Management and Budget, North American Industry Classification System, United States 1997 Manual available at http://www.census.goc/naics (7) Bureau of Census 1990 Occupational Classification System Manual available at http://www.census.gov/hhes/www/ioindex/ioindex.html (8) Bureau of Labor Statistics Occupational Injury and Illness Classification www.bls.gov/iif/oshtc.htm (9) ESRI. ArcGIS software version 7. http://www.esri.com/ (10) Missouri Census Data Center, Missouri State Library, Missouri Secretary of State. All About PUMAs (Public Use Microdata Areas). Site last modified: 11/13/2010. Accessed at: http://mcdc2.missouri.edu/pub/allabout/geo_pumas.shtml (11) United States Census Bureau. American Community Survey, 2005-2009. http://www.census.gov/acs/www/ (12) U.S. Census Bureau DataFerrett web-based application http://thedataweb.rm.census.gov/TheDataWeb/launchDFA.html (13) Groenewold MR, Baron SL. The Proportion of Work-Related Emergency Department Visits Not Expected to Be Paid by Workers' Compensation: Implications for Occupational Health Surveillance, Research, Policy, and Health Equity. Health Serv Res. 2013 (14) U.S. Bureau of Labor. Occupational Injuries/Illnesses and Fatal Injuries Profiles. Accessed at: http://data.bls.gov/gqt/InitialPage. 23
Results: i. Are the sample ED cases representative of state-wide ED cases based on demographic, employment, and injury characteristics? 25
Results: i. Are the sample ED cases representative of state-wide ED cases based on demographic, employment, and injury characteristics? 26
Results: PUMAs with top ten cumulative WR injury rates to 16-17-year-old workers in the statewide EDs, 2005-2009 ii. What regions of the state should TAW target to a) increase geographic representativeness of sample EDs and b) address regions with highest injury rates? 27