Download
1 / 50
530 likes | 860 Views
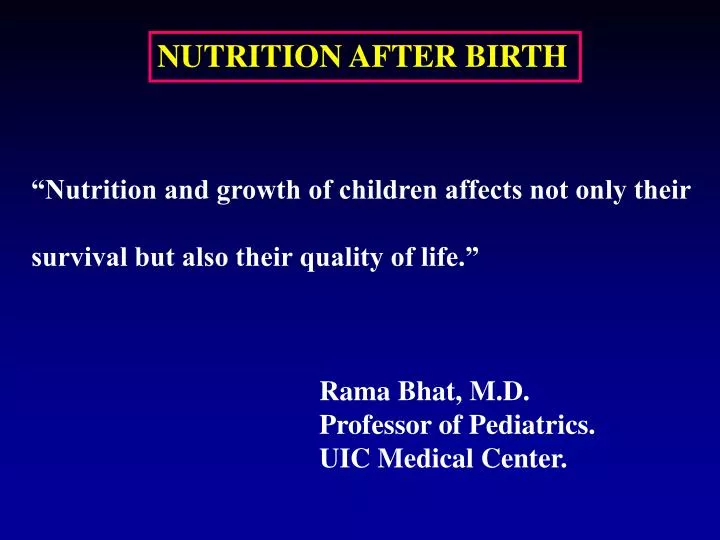
NUTRITION AFTER BIRTH. “Nutrition and growth of children affects not only their survival but also their quality of life.” Rama Bhat, M.D. Professor of Pediatrics. UIC Medical Center. Learning Objectives. Nutritional Requirement from Birth to Adolescence.

E N D
NUTRITION AFTER BIRTH “Nutrition and growth of children affects not only their survival but also their quality of life.” Rama Bhat, M.D. Professor of Pediatrics. UIC Medical Center.
Learning Objectives • Nutritional Requirement from Birth to Adolescence. • Breast Milk and Breast Feeding. • Evaluation of Nutritional Status. • Nutrients Inadequately supplied in Children. • Nutrition related problems in Childhood.
Pediatric Nutrition Nutritional requirements can be considered on the basis of: a). Age. b). Body size. c). Growth rate. d). Caloric intake. e). Physiologic losses.
Days required to double birth weight Species Days Lactose (%) Fat(%) Protein(%) Human 180 7.0 3.8 0.9 Horse 60 6.2 1.9 2.5 Cow 47 4.8 3.7 3.4 Goat 19 4.1 4.5 2.9 Rat 6 3.0 15.0 12.0
ENRGY EXPENDITURE CALORIES PER KG OF BODY WEIGHT AGE (YRS) CHANGE IN ENERGY EXPENDITURE WITH AGE.
ENERGY DISTRIBUTION CARBOHYDRATE 50% - 60% FAT 30%- 40% PROTIEN 10% - 15%
PROTEIN • Dietary protein provides energy and amino acids for the synthesis of body proteins and other tissue constituents. • Many factors affect dietary protein requirement • 95% of animal and 60- 80% of vegetable protein is digestible. • In a mixed diet, proteins supply 10-15% of daily energy requirement.
RECOMMENDED DIETARY INTAKE (RDI) FOR PROTEIN RDI Age ( months) g/kg/d g/100 kcal 0 - 1 2.6 2.2 1 - 2 2.2 2.0 2 - 3 1.8 1.8 3 - 4 1.5 1.6
PROTEIN REQUIREMENT Protein gm/kg Age (yrs)
FAT • A concentrated form of energy. • EFA is necessary for the synthesis of various Eicosanoids (prostaglandins,Thromboxanes & Leukotrienes). • Necessary for the formation of cell membranes. • Total intake should not exceed >30% of total calories (for children over 2 years old). • Intake of dietary cholesterol should not exceed 300 mg/day.
Range of average Water Requirements of Children at Different Ages under Ordinary Conditions Age Avg. body Water per kg weight (kg) of body wt in 24 hr(ml) 3 d 3.0 80-100 10 d 3.2 125-150 3 mo 5.4 140-160 6 mo 7.3 130-155 9 mo 8.6 125-145 1 yr. 9.5 120-135 2 yr. 11.8 115-125 4 yr. 16.2 100-110 6 yr. 20.0 90-100 10 yr. 28.7 70-85 14yr. 45.0 50-60 18 yr. 54.0 40-50
Age (yrs) Average Energy Allowance (kcal/kg) Protein Requirement (g/kg) Fluid Requirement (ml/kg) 0.0 – 0.5 108 2.2 120 - 150 1 - 3 102 1.2 114 - 115 7 – 10 70 1.0 70 - 85 11 – 14 (BOYS) 55 1.0 70 - 85 (GIRLS) 47 1.0 70 - 85 15 – 18 (BOYS) 45 0.9 50 - 60 (GIRLS) 40 0.8 50 - 60 ENERGY, PROTEIN, AND FLUID NEEDS IN PEDIATRIC PATIENTS
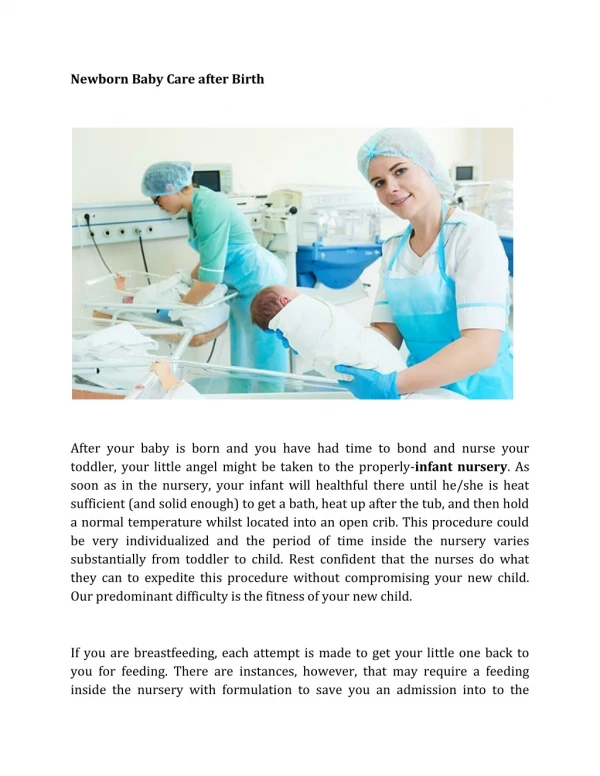
CURRENT RECOMMENDATIONS FOR FEEDING INFANTS • Nursing period (4-6M): Human milk or formula only. • Transitional period: Specially prepared foods are introduced • Modified Adult period: Mostly table food.
HEALTHY PEOPLE 2000 Goals: • 75 % of moms to breast feed their infants • in early post partum period • 50 % of moms to breast feed until their • babies are 5 - 6 months old.
Rates of Breast feeding in USA 1971 24.7% 1984 59.7% 1989 52.2% 2001 69.5%
Days required to double birth weight Species Days Lactose (%) Fat(%) Protein(%) Human 180 7.0 3.8 0.9 Horse 60 6.2 1.9 2.5 Cow 47 4.8 3.7 3.4 Goat 19 4.1 4.5 2.9 Rat 6 3.0 15.0 12.0
DEFENSE FACTORS IN HUMAN MILK AntimicrobialAntiinflammatory Secretory IgA Antioxidants, vitE vit A Lactoferrin EGF Lysozyme Catalase Oligosaccharides G-peroxide Complement C 3 Antiproteases Fibronectin Mucins
Healthy people 2010 • Goals: - Breast feeding initiation: 75% - Breast feeding at 6 months: 50% - breast feeding at 12 months: 25%
DEFENSE FACTORS IN HUMAN MILK Immunodulators Leukocytes Nucleotides Neutrophils CytokinesMacrophages Lymphocytes
HOSPITAL ADMISSIONS FOR 100 INFANTS FOR THE FIRST 18 MONTHS BY FEEDING TYPE Feeding Type Diagnosis Breast ( N=670) Artificial ( N = 388) Respiratory infect. 7.0 13.7 Gastroenteritis 3.6 5.2 Other infections 1.5 2.1
FEEDING DURING 1st YEAR Age(months)# of feedings /24 hrs 0 - 1 6 - 8 2 - 6 4 - 5 7 - 10 3 - 4 11 - 12 3 Age(months)Volume / feed (ozs) 1 2 - 4 2 5 3 5 - 6 4 6 - 7 5 - 12 8
Social Impact of Breast feeding • Savings/year $ 750 - 1200 / yr. • National savings $ 950 Million/yr.
Breast Feeding • Contraindications: • Galactosemia • Maternal drug abuse • Maternal tuberculosis • HIV positive mother • Medications: Cancer chemotherapy • Radioactive isotopes
OBSTACLES TO BREAST FEEDING • Physician apathy and misinformation • Lack of prenatal education • Disruptive hospital policies • Early hospital discharge • Lack of appropriate followup • Maternal employment • Commercial promotions of formulas • Television and magazine advertising
Month Food Items 1 - 4 Breast milk or formula 4 - 6 Iron-fortified cereal 6 - 7 Strained fruits; begin introducing cup 7 - 8 Strained vegetables 8 - 9 Start finger foods and chopped (junior) foods 9 Meats, citrus juice 10 Bite -sized cooked foods 12 All table foods
USE OF COW’S MILK • Cow’s milk should not be used until the infant • reaches 1 year of age. • Feeding Cow’s milk may cause: • Increases renal solute load. • Low vitamin C and iron. • Low EFA • Increased incidence.
SERVINGS PER DAY Women & some Children,teen girls Teen boys & older adults active women,men active men Calorie level ~1600 ~2200 ~2800 Bread group 6 9 11 Veggie group 3 4 5 Fruit group 2 3 4 Milk group 2 - 3 2 - 3 2 - 3 Meat group 2 2 3 Total (ounces) 5 6 7 Source: US Department of Agriculture.
Adolescent Nutrition 17%(39 Million) of the population in United States are aged between 10-19 years. .Reasons for nutritional problems: Anorexia, Physical Activity, Obesity, Food Habits, Pregnancy, Growth spurts.
POLICIES DIRECTED TOWARDS IMPROVING THE GROWTH OF CHILDREN • Promote and support breast feeding. • Monitor growth and development. • Introduce appropriate micronutrient rich complementary food at 6 months of age. • Prevention of obesity. • Identify infant at risk of growth failure. • Education of parents.
Adolescent Nutrition • 14% ( 36.5/million) of US population are 10-19 years old. • Reason for nutritional problems
Factors Influencing Nutritional needs in Adolescents • Onset of puberty - Increase growth rate • physical activity • changes in body composition. -Increase in body fat in girls - Increase in lean body mass(LBM) in boys.
Nutritional Concerns During Adolescence • Food habits: - skipping meals - snacking - consumption of fast foods • Results of poor nutrition: - protein intake- vegetarianism. - calcium needs. - iron and zinc - obesity - 14% (1999 survey)
Obesity Definition: BMI 85-95th percentile - At risk for overweight BMI > 95th percentile - Overweight BMI ( Kg.m2)
Prevalence of Obesity (BMI>95th percentile Age 6-11 years 12 -17 years Groups male Female Male Female all 11.3±1.8 12.8±1.9 10.6±1.3 8.8±1.4 white 10.4±2.4 14.4±2.7 9.8±2.0 8.3±3.1 AA 13.4±2.3 9.3±2.4 16.9±2.8 14.4±3.1 Hispanic 17.7±2.3 12.8±3.2 14.3±1.7 8.7±2.5
Management • Goal: to diminish morbidity and mortality risk. 1- Diet: - Prepubertal: 300 - 400 cal/day lower than required. - Older children: 500 - 700 cal/day lower. Goal is to loose 300- 500 gm weight loss/wk 2- exercise: 3- Surgical: 4- Pharmacotherapy:
INDICATORS OF NUTRITIONAL STATUS Head circumference for age <5th percentile >95th percentile Stunting/ shortness Length or height for age <5th percentile Underweight Weight- for length BMI for age <5th percentile
NEW IN THE CDC GROWTH CHARTS • charts extend to 20 years • 3rd and 97th percentile available. • Lower limits of length (45 vs. 49 cm) and height (77 vs. 90 cm) extended. • BMI-for- age charts (2-20 years) added. • 85th percentile (at risk of overweight) added.
Estimated protein intake of breast-fed infants Age Milk consumption Protein intake (months) (ml/d) (g/kg/d) 0 - 1 630 2.09 1 - 2 773 1.59 2 - 3 787 1.15 3 - 4 810 1.06
PROTEIN CONTENT OF MILK FROM SOME MAMMALS Species Protein(%) Humans 1.0 Horse 2.5 Goat 2.9 Cow 3.4 Sheep 5.5 Reindeer 11.5
Distribution of energy in human milk Stages of Fat Protein Lactose Total energy lactation (%) (%) (%) (kcal/100ml) Colostral 44 17 39 56 Transitional 48 9 43 60 Mature 50 7 43 61