Download
1 / 21
210 likes | 289 Views
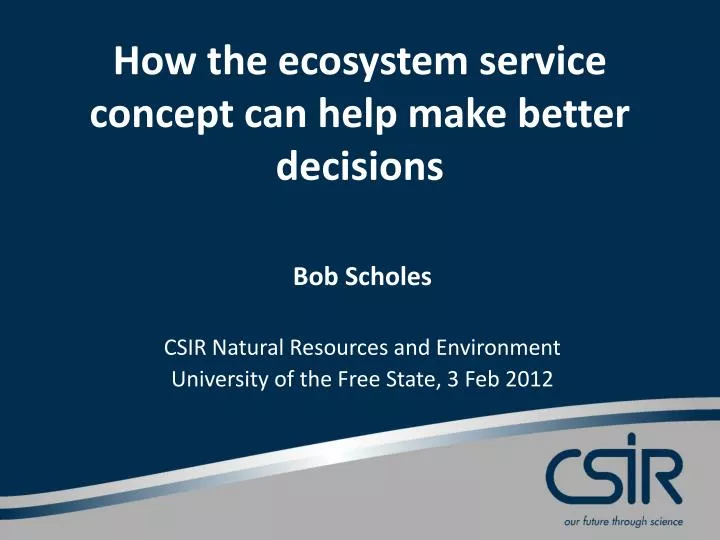
How the ecosystem service concept can help make better decisions. Bob Scholes CSIR Natural Resources and Environment University of the Free State, 3 Feb 2012. Ecosystem Services ‘the benefits people derive from Nature’. Biodiversity or ‘Life on Earth’. Human wellbeing. Material needs.

E N D
How the ecosystem service concept can help make better decisions Bob Scholes CSIR Natural Resources and Environment University of the Free State, 3 Feb 2012
Ecosystem Services‘the benefits people derive from Nature’ Biodiversity or ‘Life on Earth’ Human wellbeing Material needs Social relations Health Security Freedoms & choice MA 2005 Ecosystems and human wellbeing: a framework for assessment Island Press
A slightly modified version Scholes et al 2010 Assessing State and trends in ecosystem services and human wellbeing. Ecosystems and Human wellbeing: A manual for practitioners. Island Press
Stocks and flows Ecosystem services are always flows – they have units of quantity per unit area per unit time The underlying resource that allows the flow to be delivered may be a stock, measured in quantity per unit area For example, the stock of carbon in the soil and vegetation may reach hundreds of tonnes per hectare, but it has no value…changes in the stock do. If they represent flows from the atmosphere into the land, they have a value of around R800/tonne
Bundles and simplifications Hypothesis: in any given land use most of the value is represented by just a few services
Can you put a value on Nature?Specifically, can and should we assign a Rand value? A ‘common currency’ makes tradeoffs and optimisation explicit and possible to build into the price ‘Money talks’ – persuasive measures for development funders Facilitates inter-study comparisons Ethical questions – what is the value of a life or a species? Non-market services (eg the value of a view) require indirect methods which may be very unreliable
Total Economic Value has many partsScholes, RJ et al 2001 Ecosystem services and human wellbeing: A handbook for Practitioners. Ed Ash, N et al Chap4 Island Press
Total economic value often goes down with ecosystem transformation for ‘development’ Why does this apparently irrational behaviour occur? because private financial benefits are often greater in the converted system, while the public costs increase even more
The ‘Natural Capital’ approach Natural capital is a consistent way of converting diverse flows of ecosystem services into common-metric stocks, which can be added to other measures of wealth, such as Manufactured Capital or Human Capital, to give ‘Inclusive Wealth’ Natural Capital is the net present value of the future yields of ecosystem services It is a useful conceptual way of quantifying the effects of degradation Arrow,K, P Dasgupta,L Goulder, G Daily, P Ehrlich,G Heal, S Levin, K-G Maler,S Schneider, D Starrett and B Walker 2004 Are We Consuming Too Much?Journal of Economic Perspectives 18 (3): 147–172
Despite economic growth,Africa is getting poorer Inclusive wealth = Manufactured capital+Human Capital+Natural Capital Arrow,K, P Dasgupta,L Goulder, G Daily, P Ehrlich,G Heal, S Levin, K-G Maler,S Schneider, D Starrett and B Walker 2004 Are We Consuming Too Much?Journal of Economic Perspectives 18 (3): 147–172
Real savings,corrected forresource depletion,are negative Millennium Ecosystem Assessment 2005 Ecosystems and Human Wellbeing: Synthesis
Using natural capital todefine and quantify degradation Scholes, RJ 2009 Syndromes of dryland degradation in southern Africa. AJRFS 26, 113-125
Degradation of ecosystem services causes loss of value Degradation tends to lead to the loss of non-marketed benefits from ecosystems The economic value of these benefits is often high and sometimes higher than the marketed benefits Timber and fuelwood generally accounted for less than a third of total economic value of forests in eight Mediterranean countries.
You don’t strictly need to bring everything to common metrics…. …for tradeoff analysis, it is only necessary that you be able to quantify the service yield, in its own metrics, relative to a common measure of intensity of use It is the shape of this function that matters most
Non-monetary metricsexample: greenhouse warming potential 1 t CO2 = 1/25 t CH4 = 1/298 t N20 ~ a few picoWatts/m2
Land use intensification exampleBalmford, A., R. E. Green, and J. P. W. Scharlemann. 2005. Sparing land for nature: exploring the potential impact of changes in agricultural yield on the area needed for crop production. Global Change Biology 11:1594–1605. Phalan, B et al 2011 Reconciling Food Production and Biodiversity Conservation: Land Sharing and Land Sparing Compared Science 333: 1289-1291. Pre-cultivation biodiversity Biodiversity Crop yield Level of agricultural inputs Conclusion: if you want to have a given level of agriculture, but protect as much biodiversity as possible, it is often best to have intensive agriculture on a limited area
In reality, intensification involves both area expansion and increased inputs per area, and they have differentconsequences for biodiversity on- and off-site Constructing the agricultural output curve Crop area * yield per area Progressively more marginal land needs more inputs Agricultural output Area cultivated Inputs per area intensification
Building up the biodiversity loss curve Biodiversity Index Terrestrial biodiv loss Freshwater biodiv loss Habitat loss Fragmentation Nutrient leakage Area cultivated Inputs per area intensification
Relative responses to a shared fundamental driver The dependent axes do not need to be in common units The independent axis needs to be shared
Look at the differentials and their ratios A B Have lost much biodiv, so you may as well intensify Nice, but does not meet the minimum food production target Likely range Marginal food gains for major off-site biodiversity impacts
Is biodiversity per se an ecosystem service? In my opinion, generally no, with the following exceptions: Where the biodiversity itself is the reason for tourism Specialist birdwatchers Botanical tourists Indirectly, where biodiversity enhances a supporting service (eg primary production, pollination) or a regulating service (eg constancy of production, or suppression of pest outbreaks) Individual elements of biodiversity clearly provide services All domesticated species and wild-harvested resources